Juniper SRX Integration
A HPE Juniper Networking SRX firewall is a high-performance, next-generation security platform from HPE Juniper Networks that combines advanced firewall capabilities with routing, VPN, and threat intelligence features in a single, scalable appliance or virtual device for enterprise and service provider networks.
ClearPass can authenticate users across wired, wireless, and VPN infrastructures. The integration with Juniper SRX allows ClearPass and the SRX Series device to collaborate in environments in which they are deployed together.
Integrating ClearPass with Juniper SRX endpoint context server typically tags the username context, as well as the external devices being authenticated, along with its respective IP address, which further simplifies IP address management on the Juniper SRX endpoint context server side.
18 minute read
Author: Zak Emerick, Herman Robers
Introduction and Overview
 INFO
INFO
This document does not cover the basic steps of deploying the SRX, configuring zones, basic policy etc. There is an assumption that these steps are already completed.
In preparation for the integration with the ClearPass Policy Manager certain minimum configuration is required on the SRX firewall to allow ClearPass and the SRX to communicate, share context and optionally allow the SRX to query ClearPass for session information.
The integration with the SRX supports two separate workflows:
-
Push model with webapi: ClearPass pushing context directly into the SRX.
-
Pull model with user-query: SRX to pull or query context from ClearPass. There are certain use cases when it is relevant for the SRX to query user context, such as when the SRX has been out of service for a software upgrade or when a new firewall comes online and needs to be aware of the current active network sessions.
Either workflows, or both, can be configured. Note that the pull model will add additional load to the ClearPass appliance.
Configuration of SRX webapi (Push Model)
Since SRX versions starting with 25.0 deprecated the WebUI, it’s currently recommended to configure the SRX via the CLI or configure the equivalent using Juniper Security Director.
Login to SRX using SSH to access the CLI. From the root prompt (for example, root@SRX650-TME%), enter the command cli to enter operational mode, then type configure or edit to enter configuration mode.
From configuration mode, configure the webapi service. Some of the information entered here will be used later when configuring ClearPass. The username and password will be used again when configuring ClearPass, so record them.
set system service webapi user <UserName> password <Password>

set system service webapi client <ClearPass IP>
NOTE: If you have multiple ClearPass instances, a client must be created for each IP address.
set system service webapi https port <8443>
INFO
Do not set the HTTPS port to 443. This will conflict with the WEBUI port.
set system service webapi http port <8080>
INFO
Do not set the HTTP port to 80. This will conflict with the WEBUI port. Also it is recommended to use HTTPS to keep the communication secure. webapi over HTTP should only be used for testing in lab.
set system service webapi https default-certificate
Generating a custom certificate is outside the scope of this document but is strongly recommended for production deployments.
set system service webapi debug-level error
Confirming configuration.
matt@nac-srx.arubasecurity.net# show system services webapi
user {
    cppm-api-user;
    password "$9$unNcOBESrvx-wp0BESeXxjHqmQF69A01R"; ## SECRET-DATA
}
client {
    10.127.208.77;
    10.127.208.76;
}
http {
    port 8080;
}
https {
    port 8443;
    default-certificate;
}
debug-level {
    error;
}

[edit]
INFO
-
Only one user account can be defined. This is the account configured on ClearPass within the Endpoint Context Server that is used to authenticate to the SRX.
-
A maximum of 20 clients can be defined. Also, note the default http [8080] and https [8443] ports are configured.
Configuring ClearPass for SRX Integration (Push Model)
The following items are a prerequisite for the integration to function properly.
-
Enable Insight at Administration -> Server Configuration -> Click Server -> Enable Insight
-
Enable Interim Accounting-Update Packet logging at Administration -> Server Configuration -> Click Server -> Service Parameters -> Radius Server -> Log Accounting Interim-Update Packets
-
Review Eager-Handler polling frequency setting at Administration -> Server Configuration -> Click Server -> Service Parameters -> Async network services -> Eager handler polling frequency. This defines how often updates are sent to SRX. Note that only true delta is sent which means if the device goes down and immediately comes up within the polling interval, the net effect is that nothing has changed and hence no update is sent.
Add the Juniper SRX as a Context Server
Navigate to Administration -> External Servers -> Endpoint Context Servers -> Add
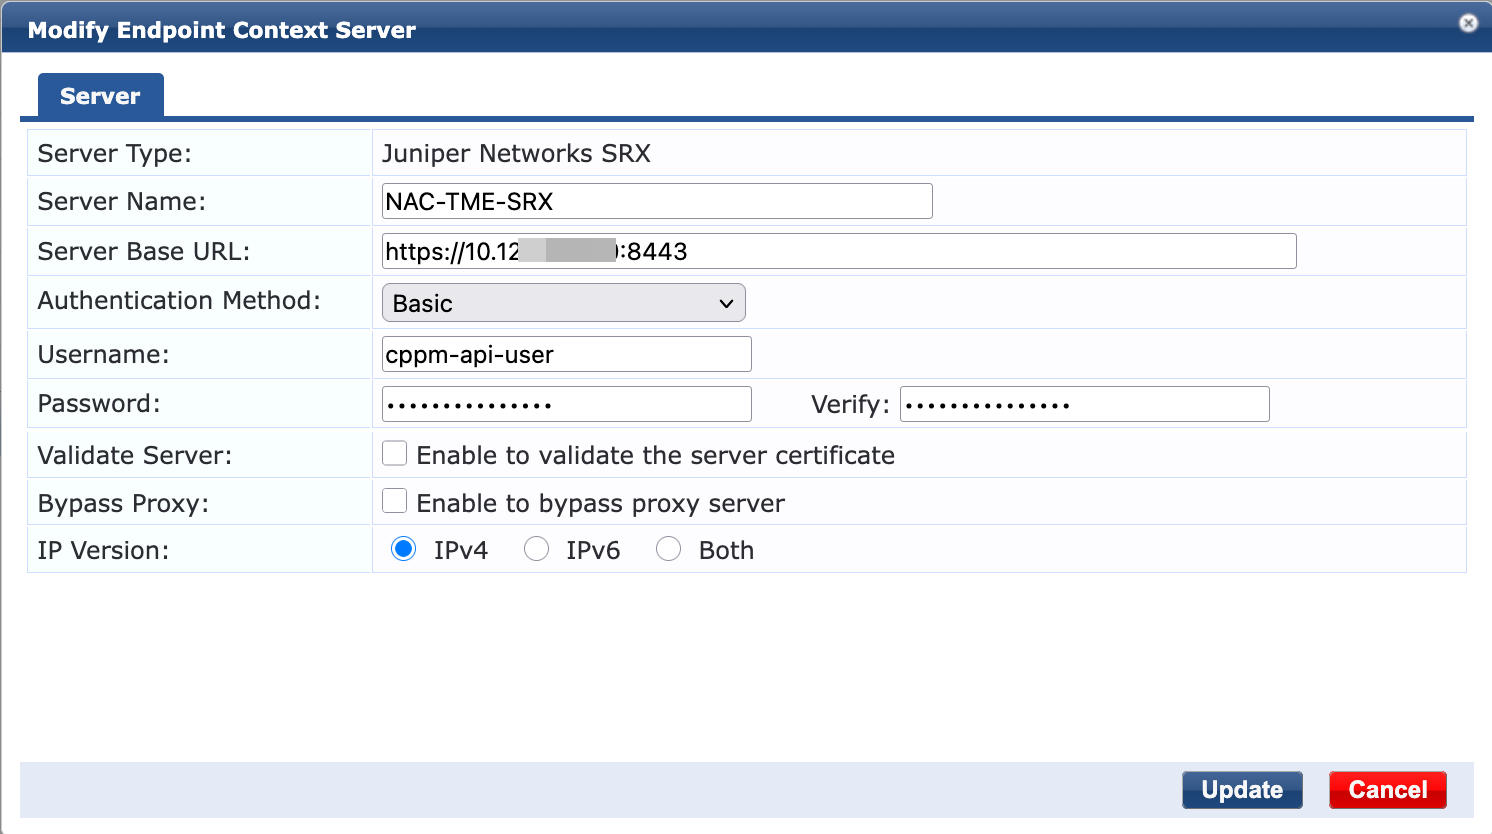
Add the port to the URL that was configured on the SRX (for example,8443). Next, add the Username and Password as configured previously.
 NOTE
NOTE
It is best practice to use a trusted certificate on the webapi service of the SRX firewall and to validate that certificate in ClearPass. The root CA that issued the WebAPI server certificate, would need to be installed in the ClearPass Certificate Trust List with Usage type: Endpoint Context Servers.
ClearPass Enforcement Policy and Profile
An Enforcement Profile and Enforcement Policy must now be created to send the context update to SRX based on specific policy conditions. For example if the use case is to apply specific firewall policies to IoT devices, the enforcement policy can be setup in such a way that the update is triggered only for such devices.
To create enforcement profile, navigate to Configuration -> Enforcement -> Profiles -> Add
Select the “Session Notification Enforcement” template.
Select Session-Notify as the type for each entry
Select Juniper Networks SRX as the Server-Type
Select Server-IP and the SRX host previously defined.
For the final two Session-Notify fields (“Login/Logout Action”), select the Juniper Networks SRX Login and Juniper Networks SRX Logout values respectively. If the expected Login/Logout server actions do not appear, verify the previous configuration steps.
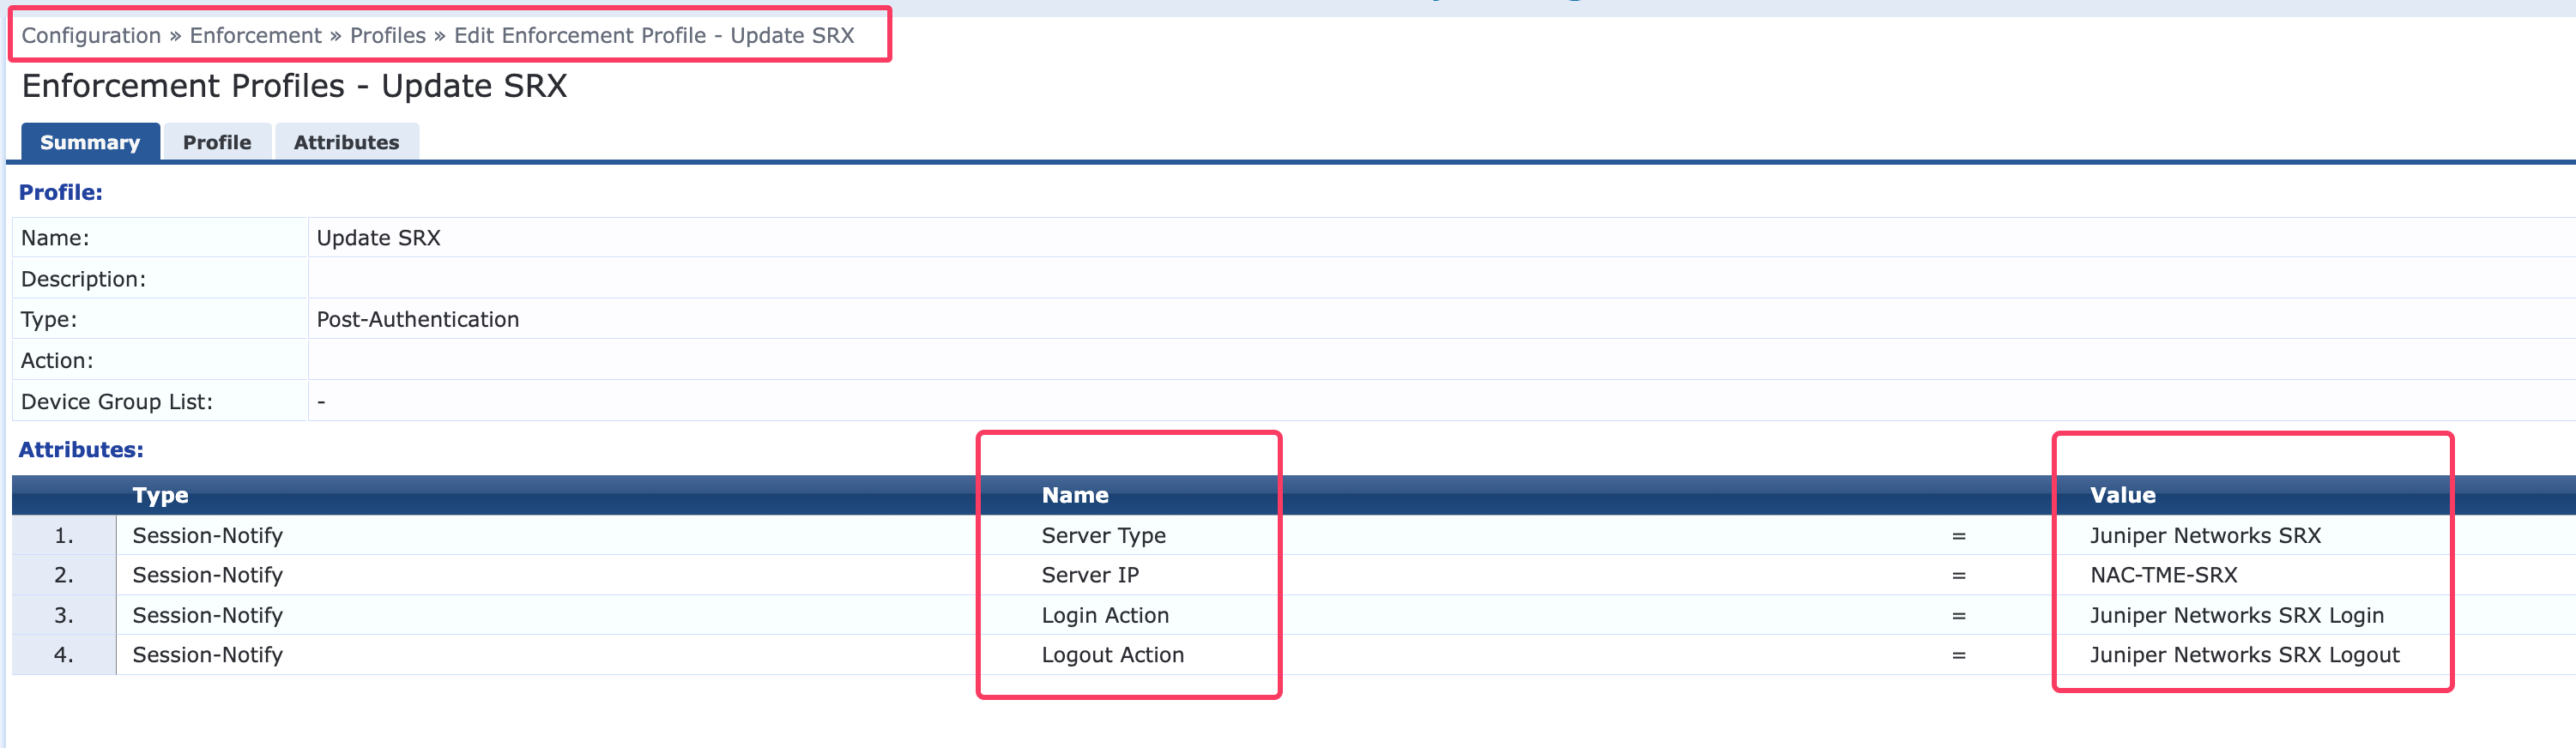
To create an Enforcement Policy, navigate to Configuration -> Enforcement -> Policies -> Add
INFO
If an established Enforcement Policy already exists, the newly created Enforcement Profile can simply be added to it. There is no need to create a custom Enforcement Policy solely for this workflow.
In the example below, there are different policy conditions that triggers the Post-Authentication Enforcement Profile “Update SRX” created above when the device is both compliant as well as non-compliant
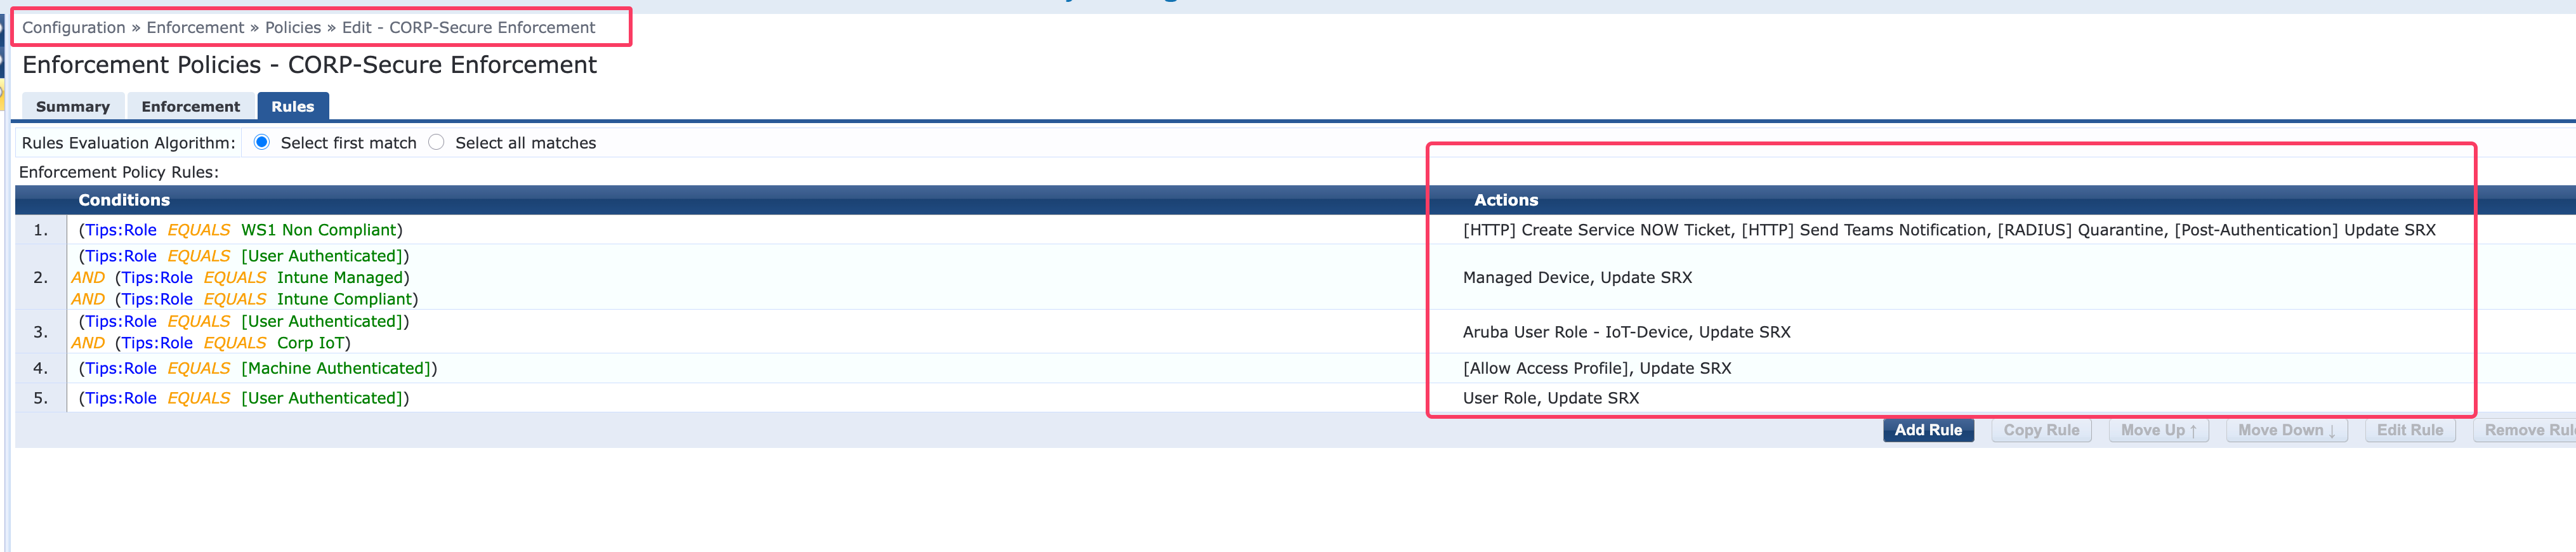
The Enforcement policy must then be attached to the relevant Services.
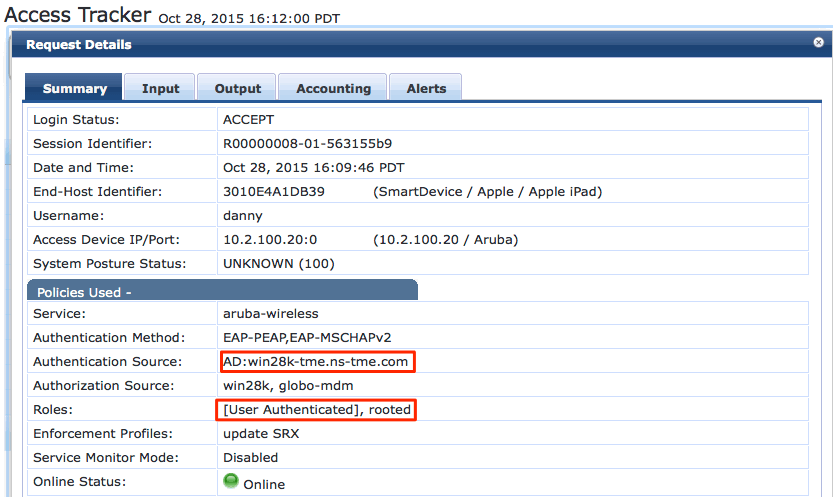
Validating that the enforcement policy and profile is working correctly from ClearPass Access Tracker
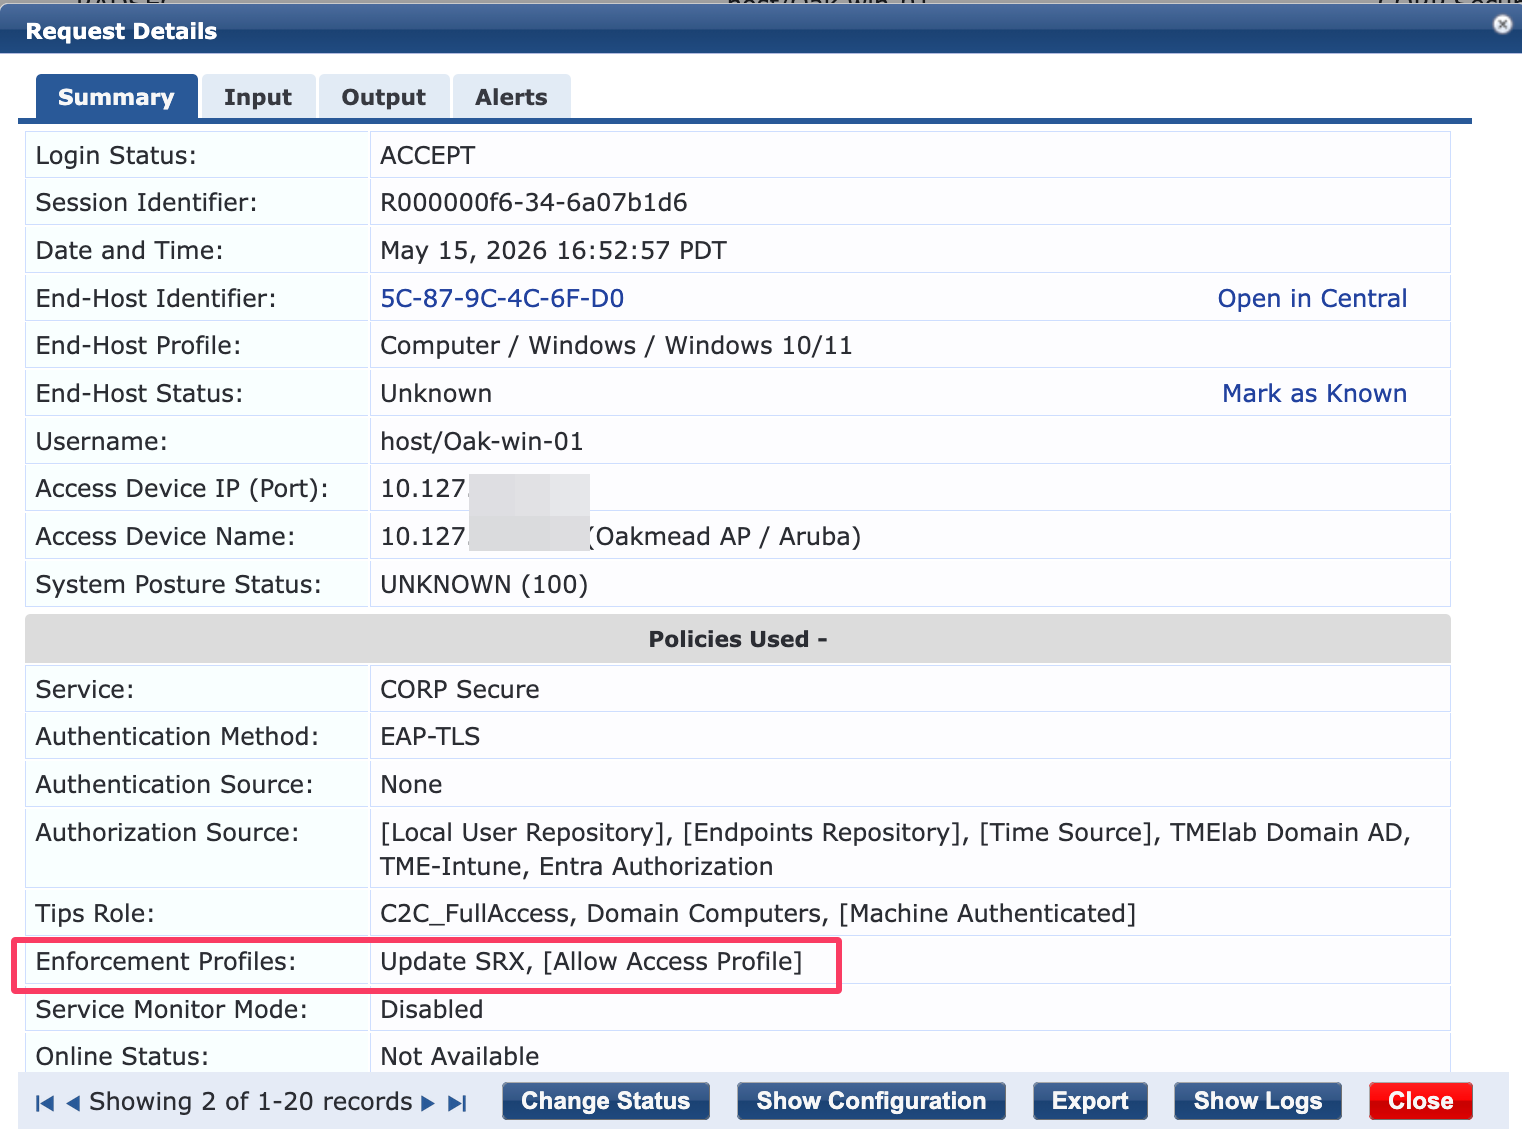
Configuration of ClearPass for SRX Integration (Pull Model)
The HPE Juniper SRX can also query ClearPass to obtain authentication session information. Powered in part by REST and OAuth2, the SRX can query the ClearPass Insight Database to obtain the needed data for session context on the firewall. It is possible, though unlikely, that the SRX will not have context for an active network user. When the SRX is required to police a traffic flow and does not have the user’s context, it can query ClearPass. After receiving the query result, the SRX updates its auth-table and applies policy to the user appropriately.
The process to query a ClearPass appliance uses OAuth2 as the authentication method. This must be configured first to allow the user-authentication process.
Configure OAuth2 Client on ClearPass
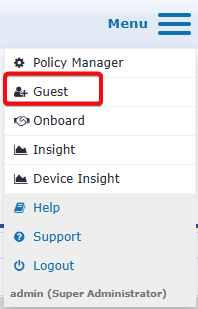
The first part of this configuration is to set up OAuth2 as an API client. Log in to ClearPass and access the Guest module from the Menu in top right corner
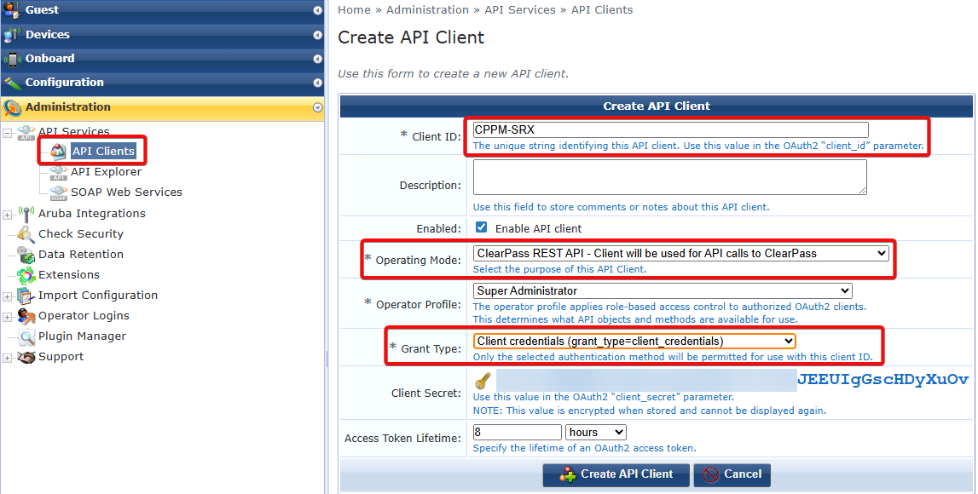
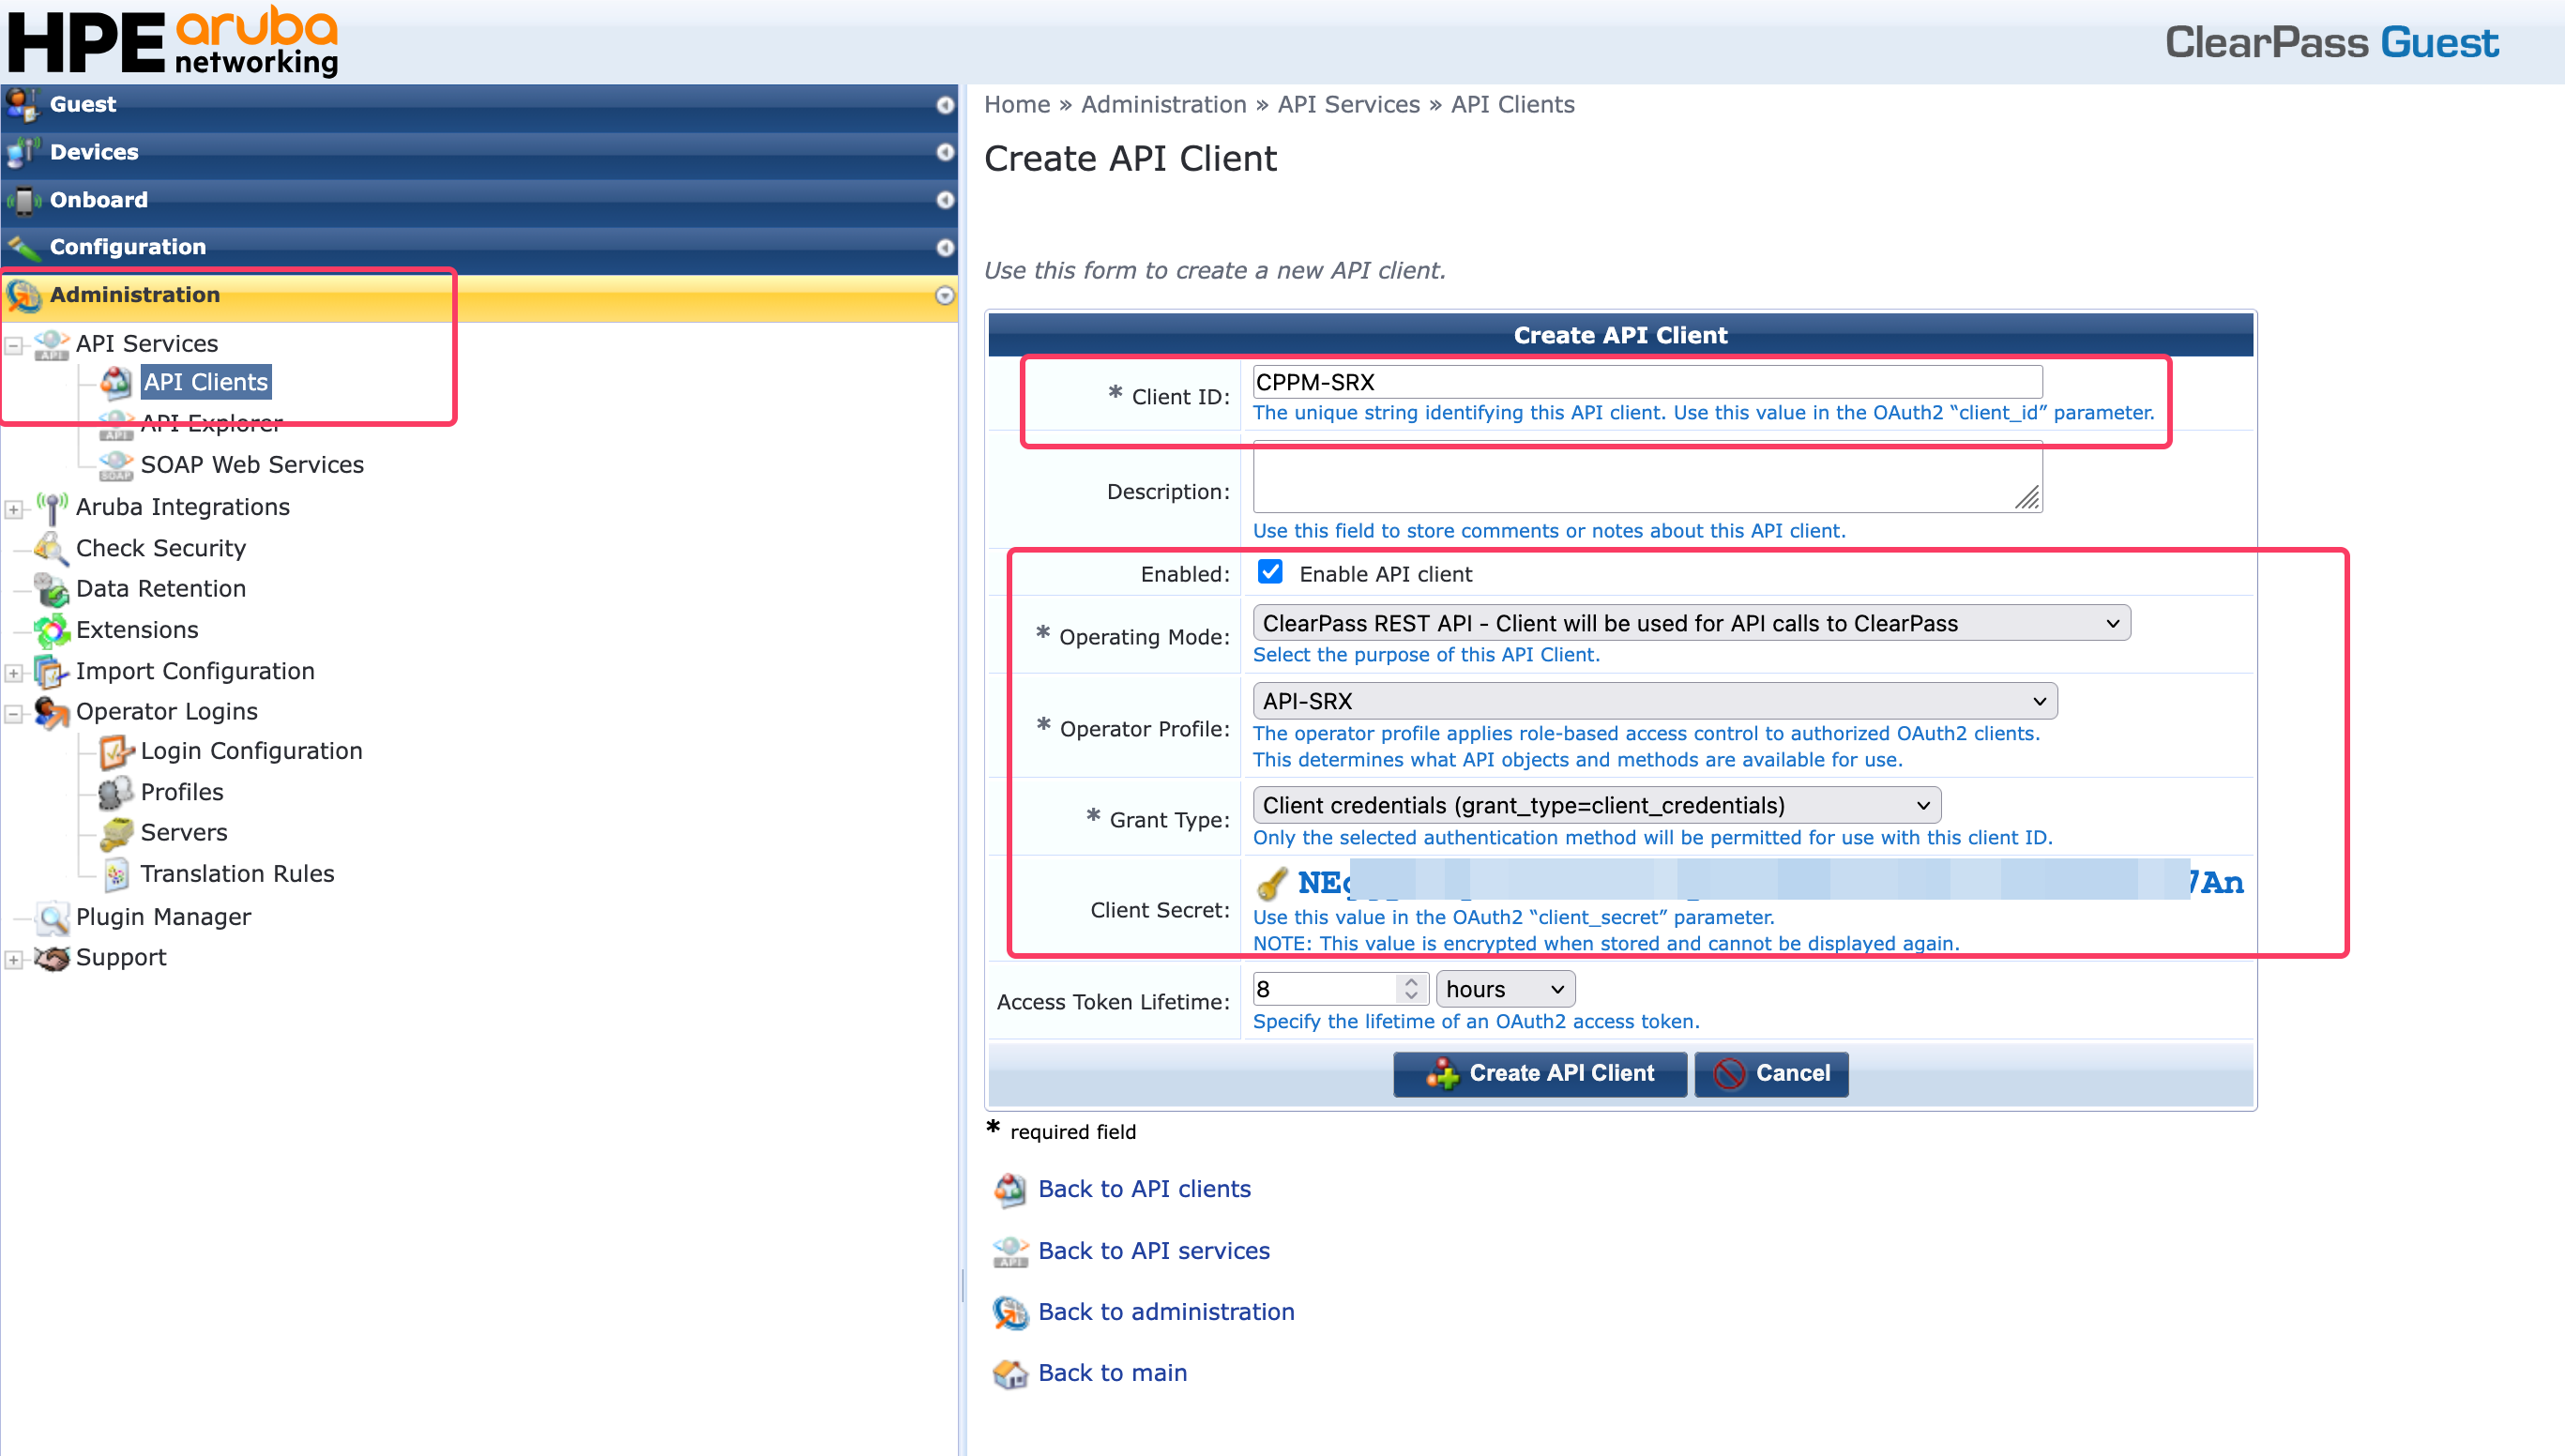
Navigate to Administration -> API Services -> API Clients ->
INFO
-
Record the Client ID. It will be needed later.
-
Copy the Client Secret immediately. Once the API client is created and the screen is exited, the Client Secret cannot be displayed again. A new client secret can be generated if needed.
-
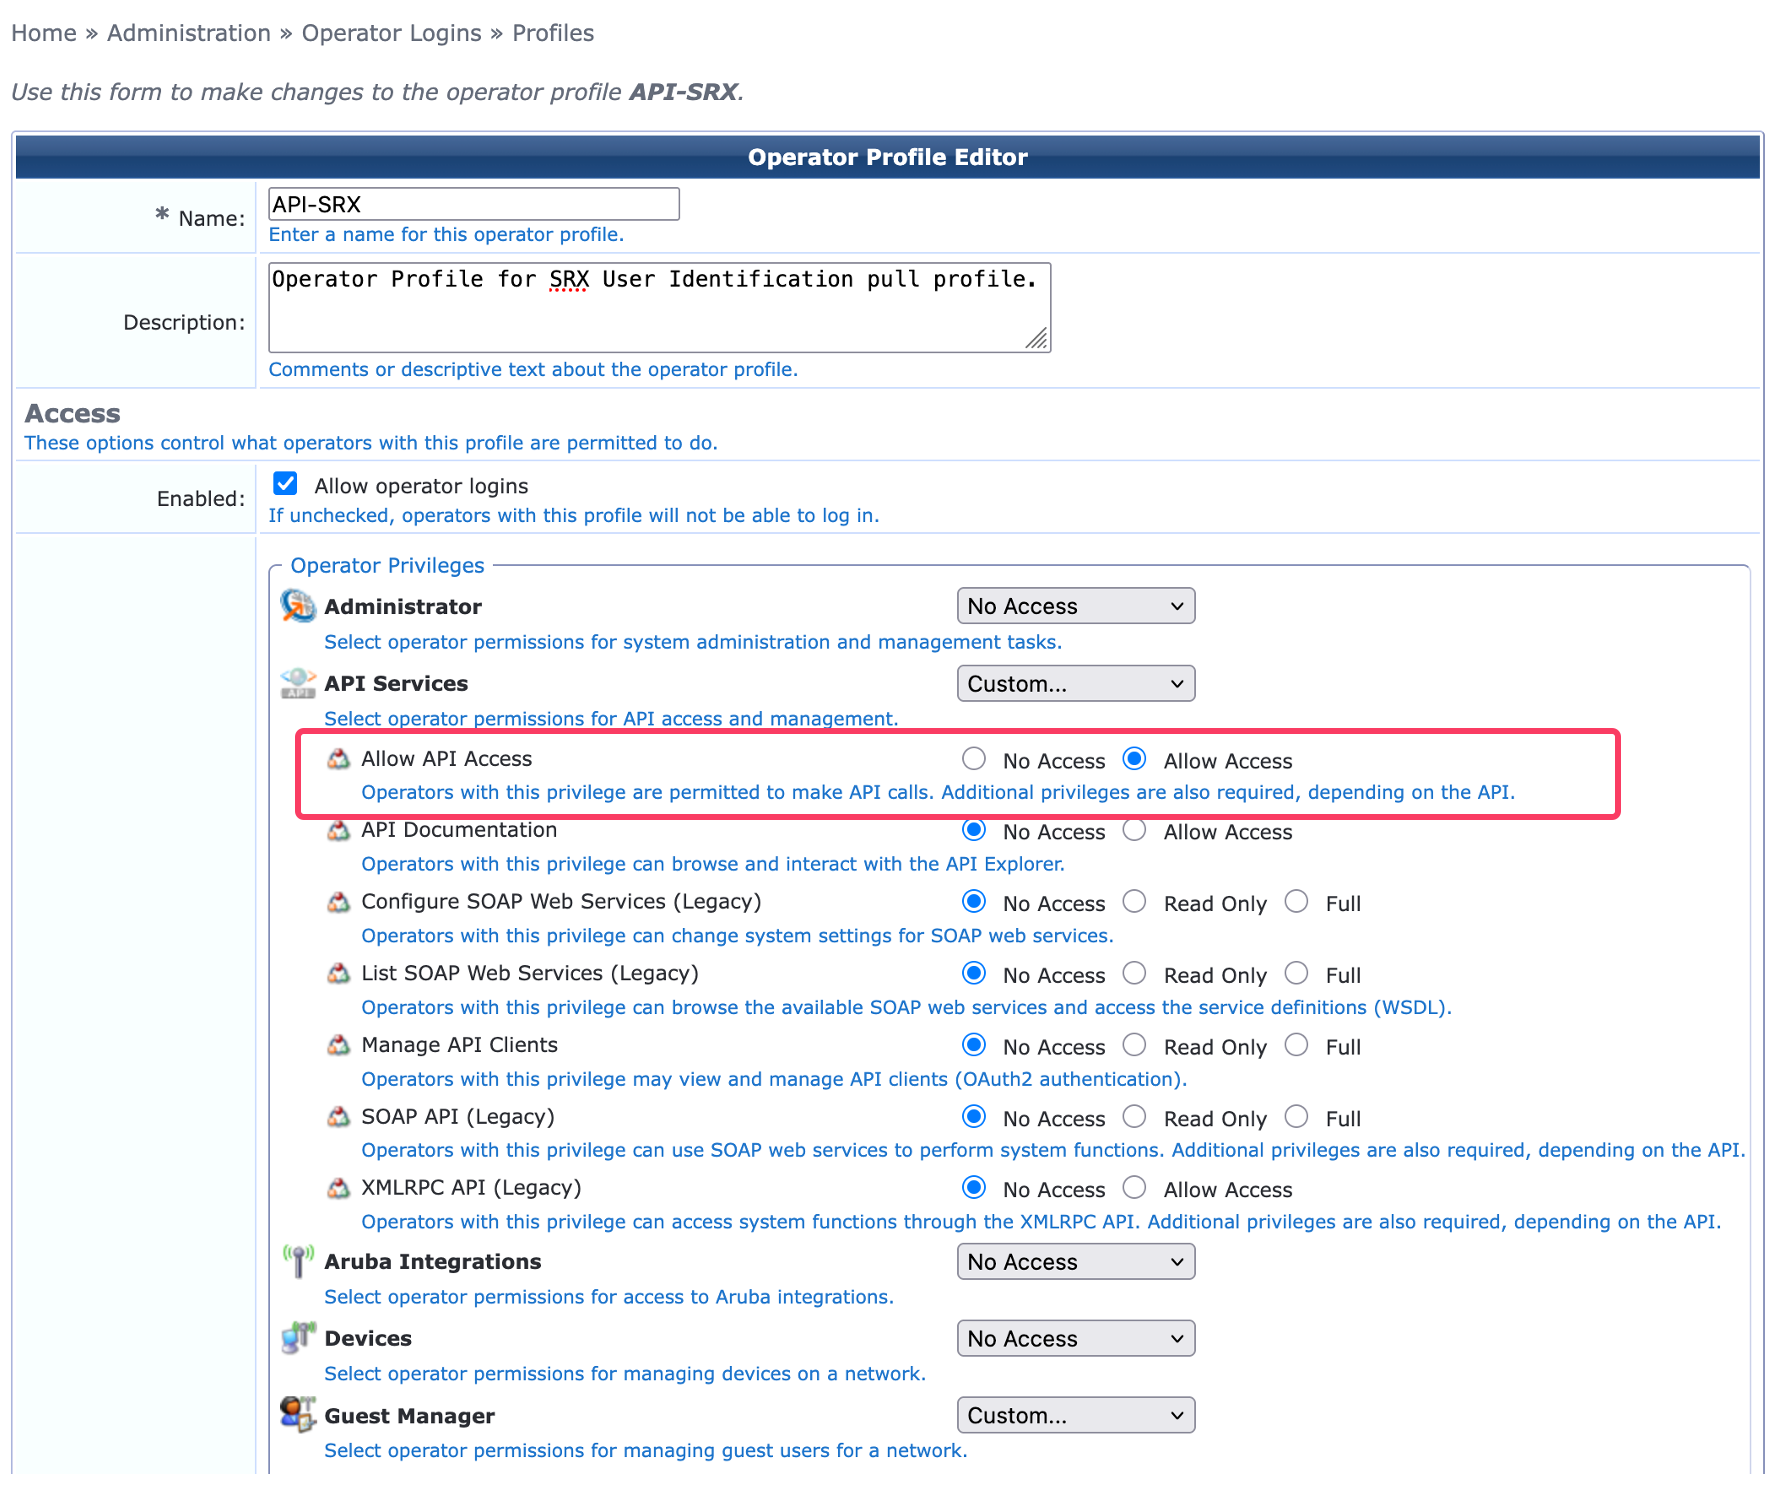
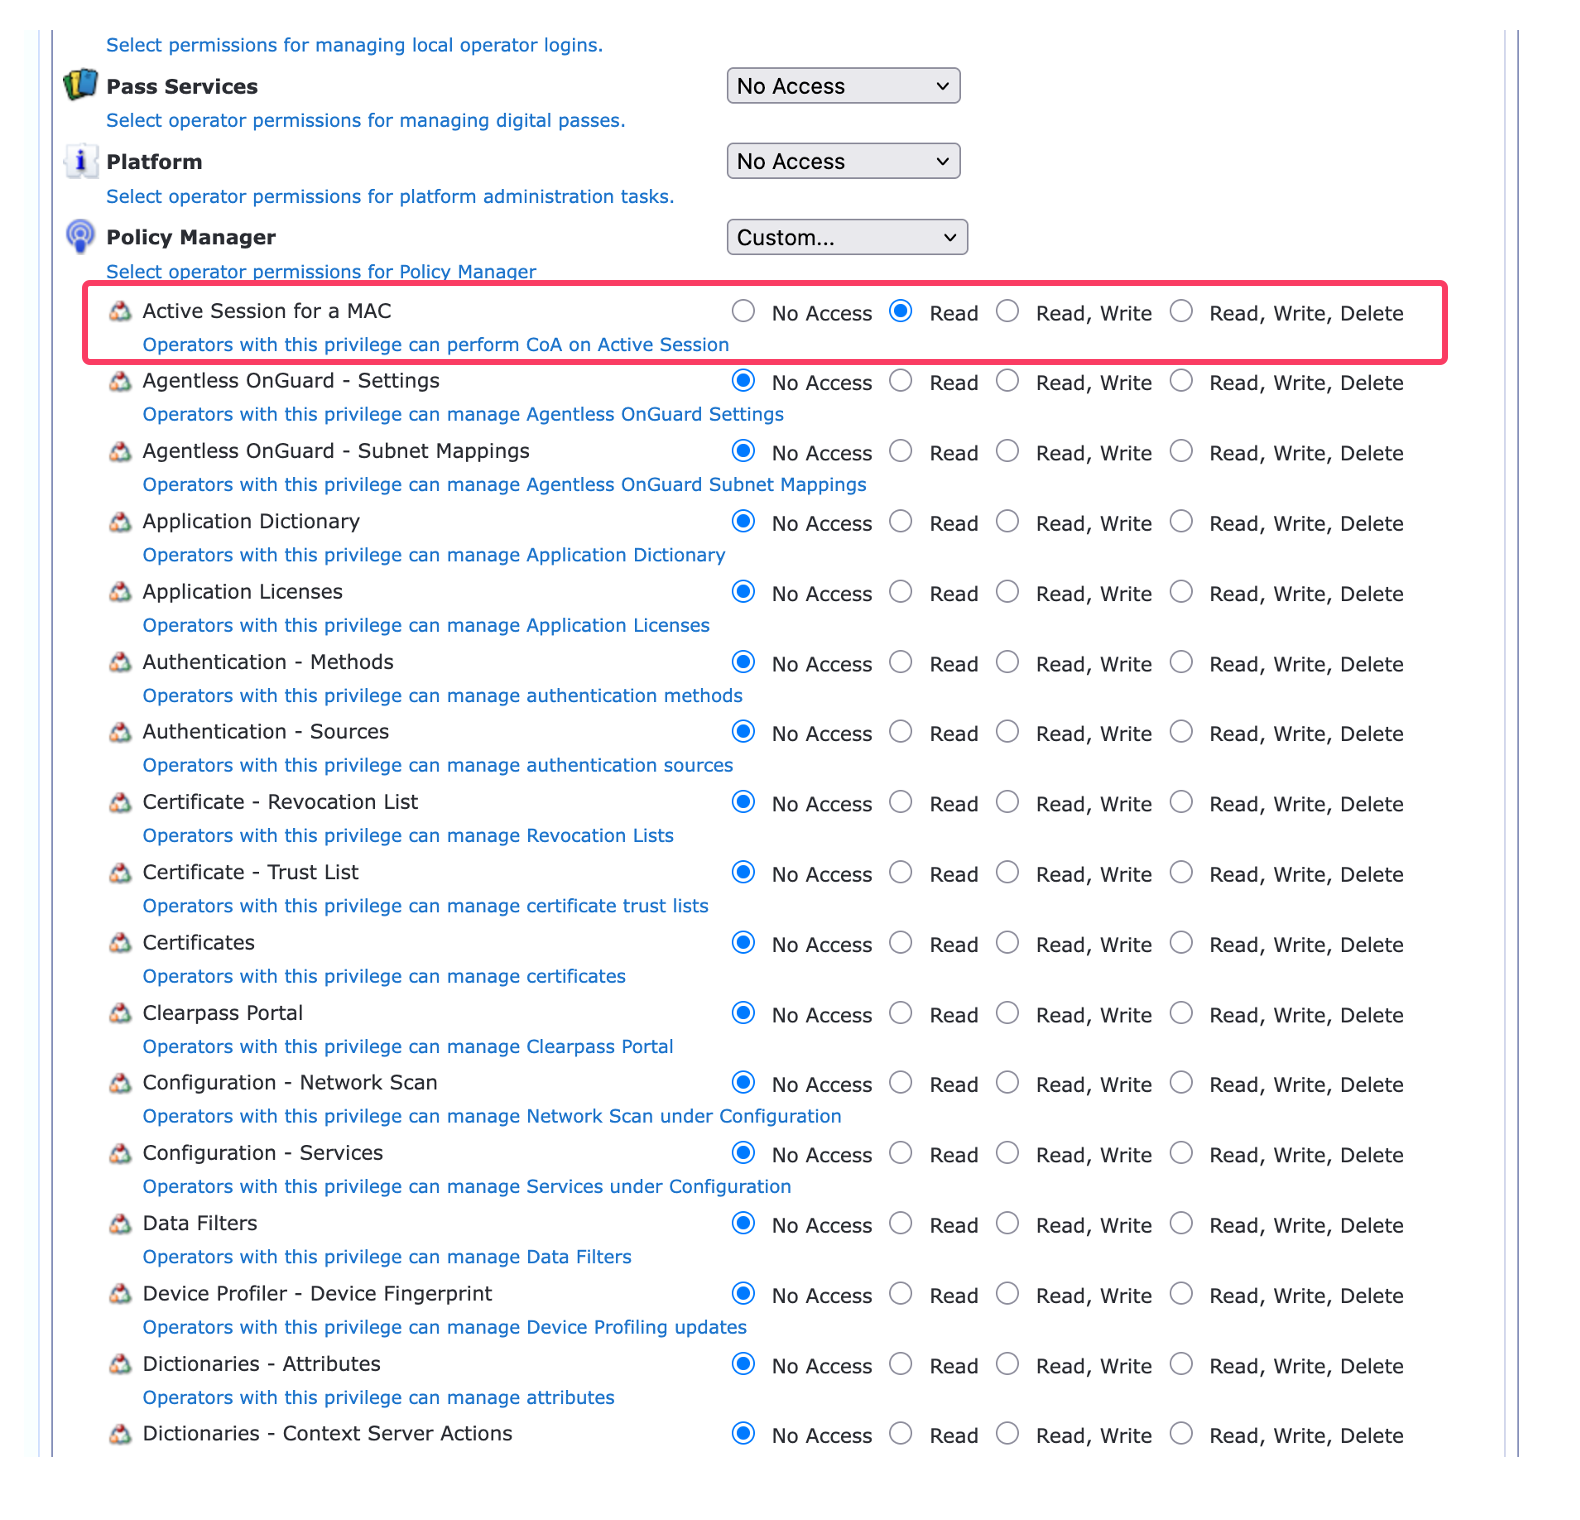
Super Administrator privileges are not necessary. This profile should be scoped appropriately in a production environment. Sample operator privileges documented below.
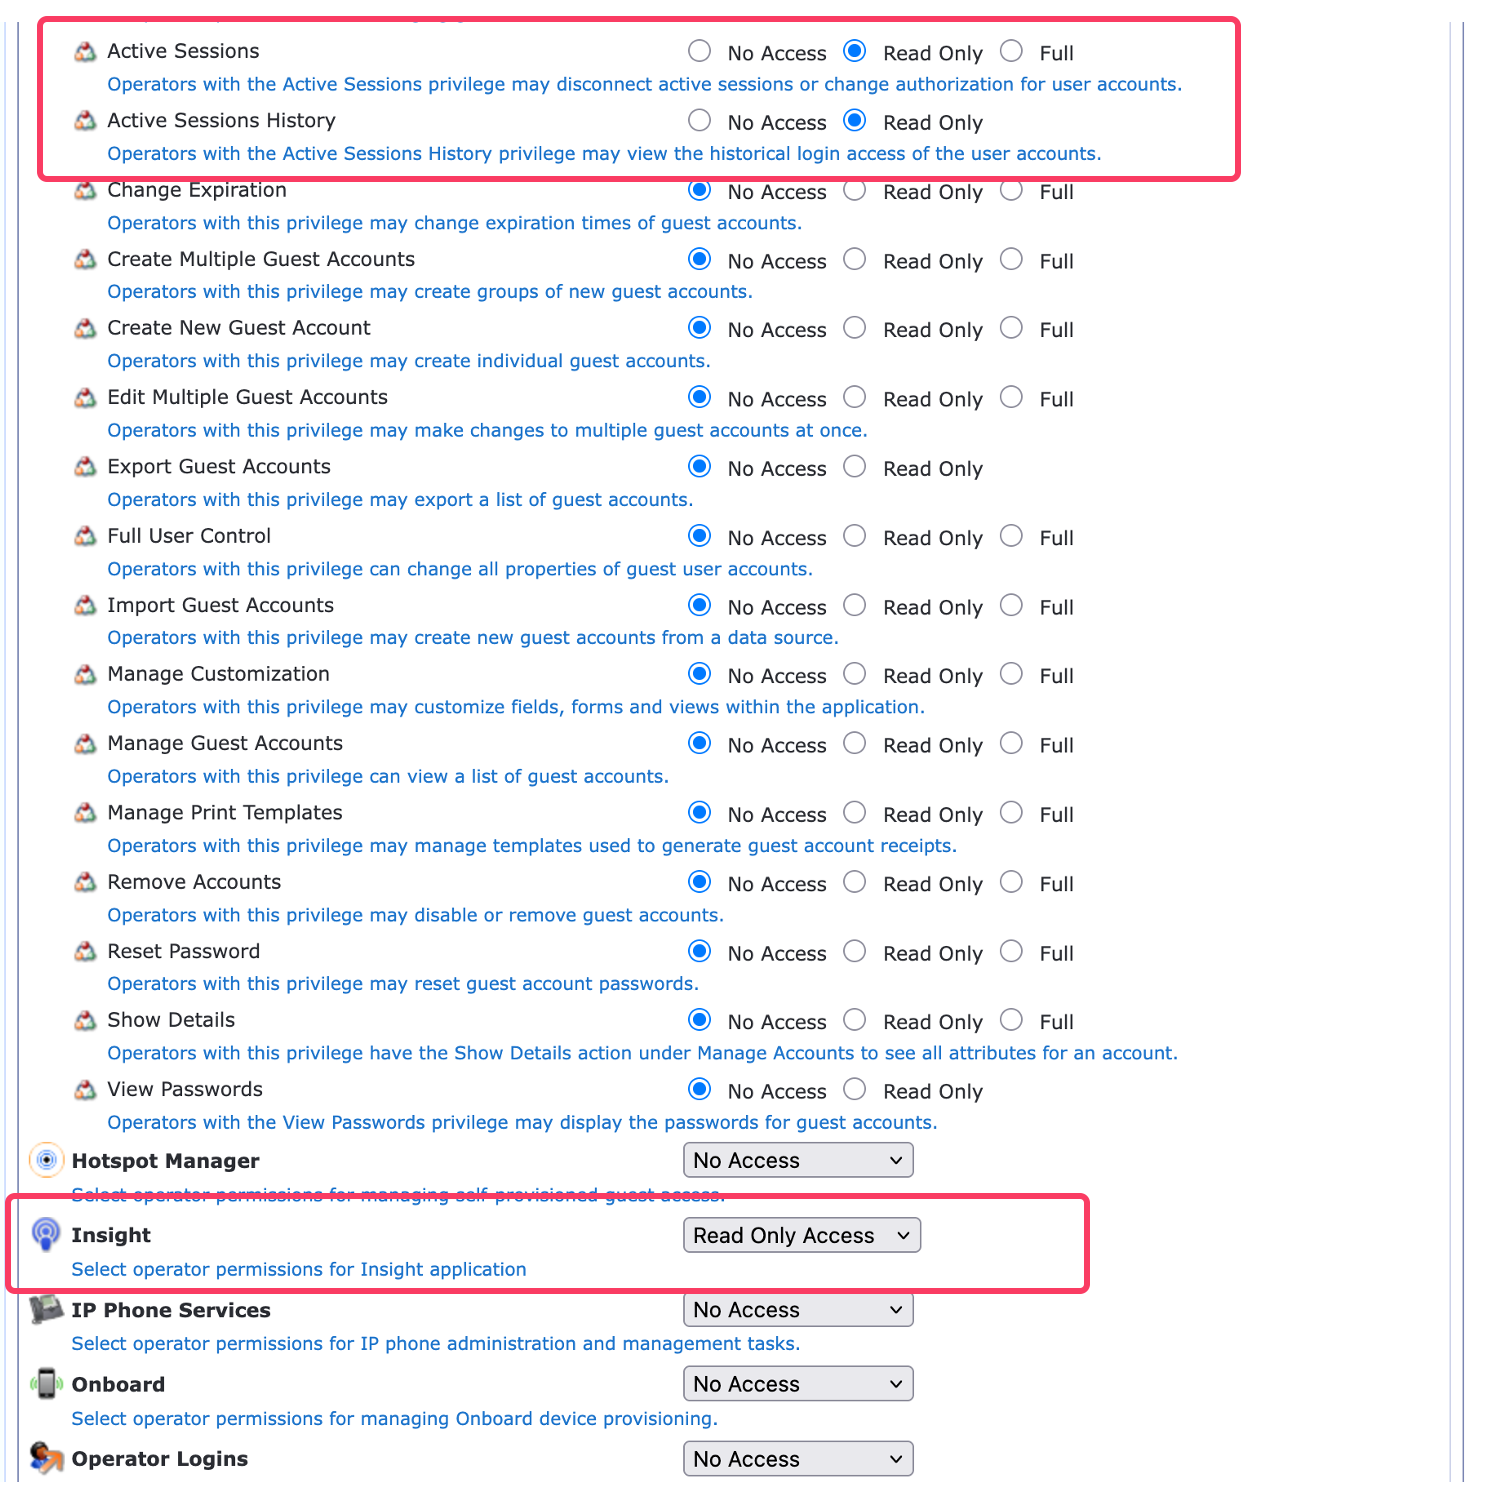
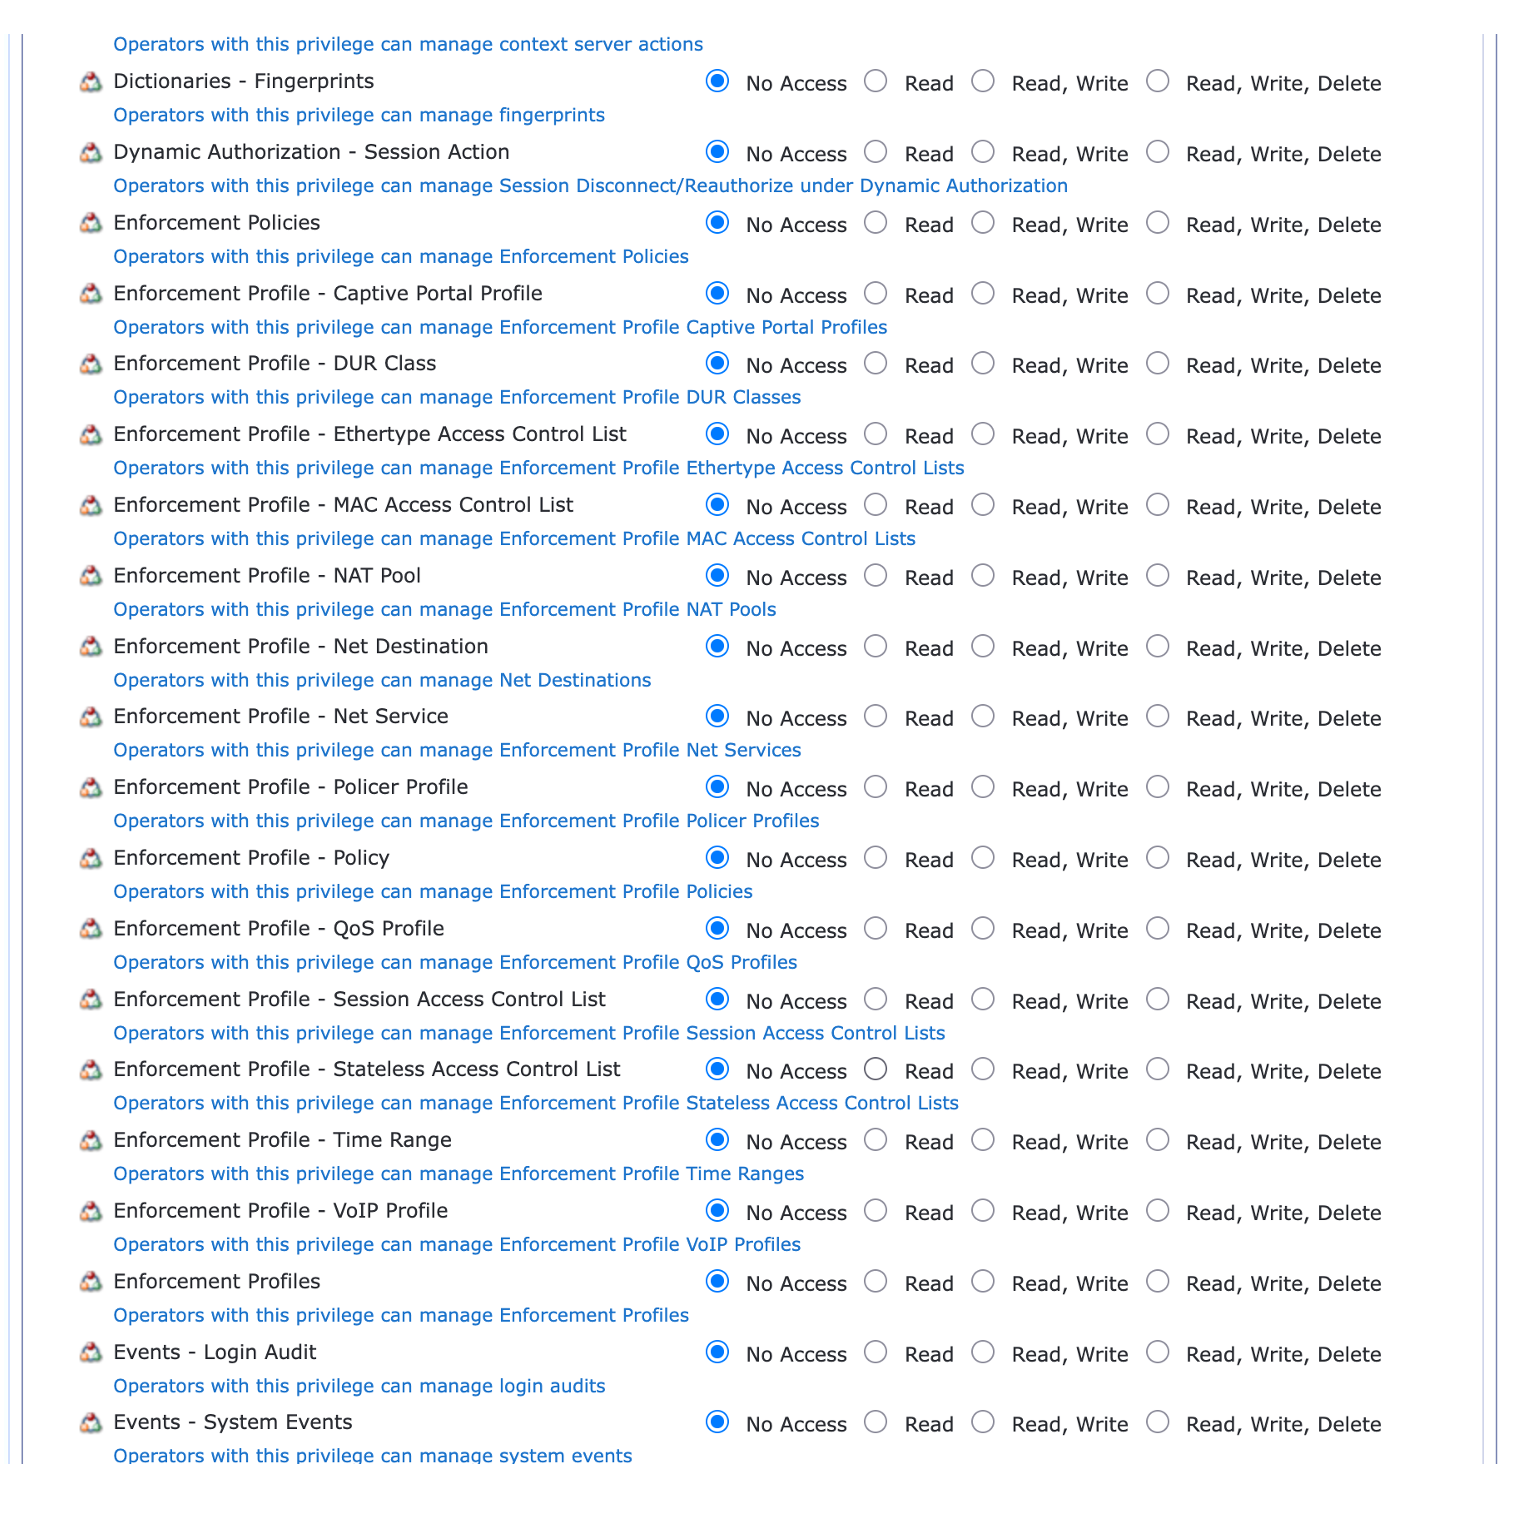
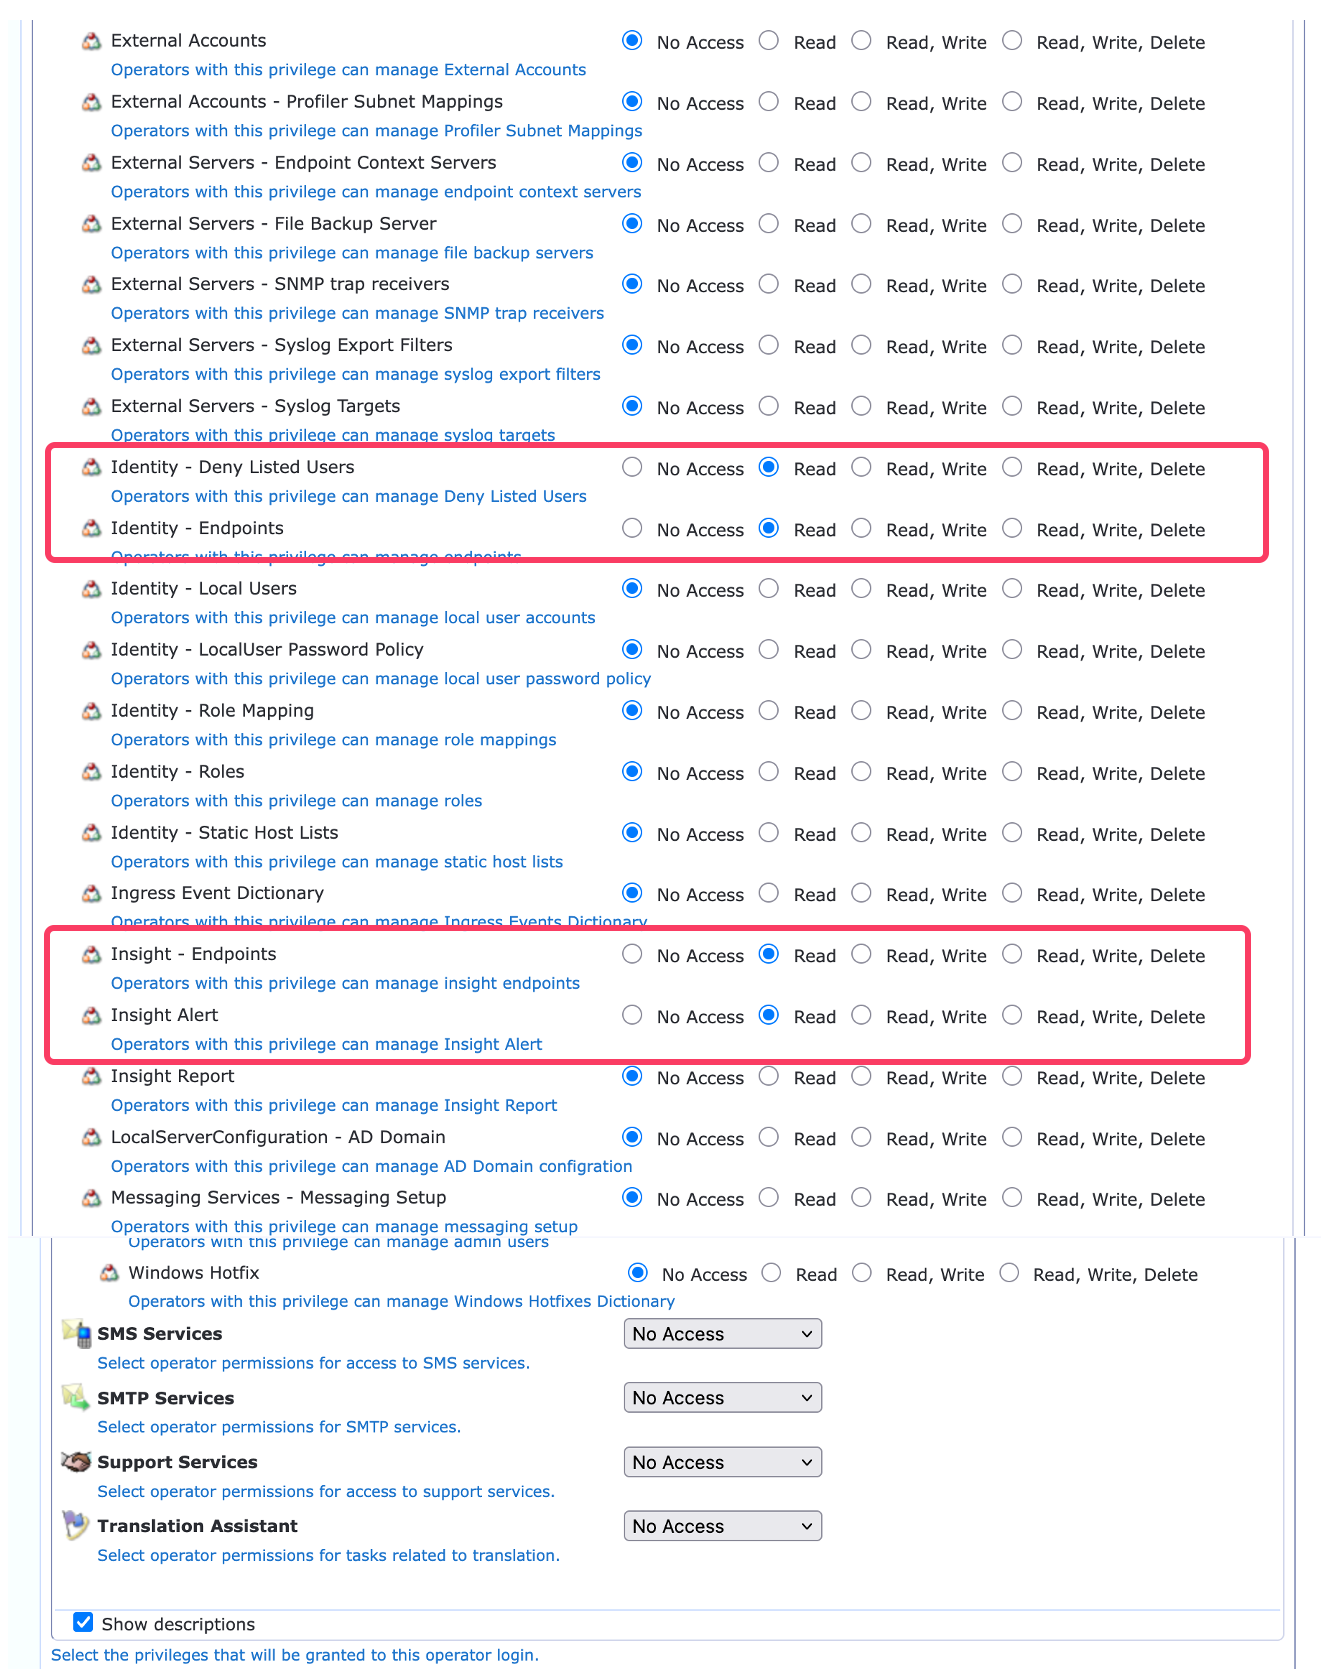
Sample Operator Privileges Set the following permissions though Custom Access to the Operator Privileges Sections:
API Services > Allow API Access: Allow Access
Guest Manager > Active Sessions: Read Only
Guest Manager > Active Sessions History: Read Only
Policy Manager > Active Session for a MAC: Read
Policy Manager > Identity - Deny Listed Users: Read
Policy Manager > Identity – Endpoints: Read
Policy Manager > Insight – Endpoints: Read
Policy Manager > Insight – Alert: Read
All other settings should be set to: No Access.
Note that there is an option to generate an Access Token. This step is not required for this integration. The access token used by the SRX is generated dynamically by the SRX using the Client Secret.
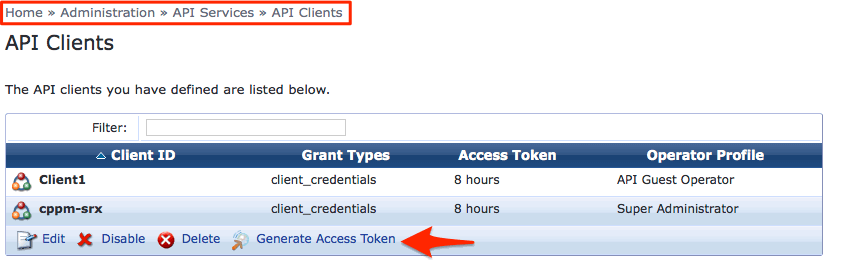
No need to Generate Access-Token here
HPE Juniper SRX Configuration
Add ClearPass as a user identification authentication source. The name used is only a label. It is not tied to an FQDN, etc.
set services user-identification authentication-source aruba-clearpass
user-query web-server CPPM-Label
Define the connection method to be used (https or http).
set services user-identification authentication-source aruba-clearpass
user-query web-server connect-method https
Define the IP address of the ClearPass appliance the SRX will communicate with.
set services user-identification authentication-source aruba-clearpass
user-query web-server address <ClearPass IP>
Define the Client ID created previously in the Guest API Services.
set services user-identification authentication-source aruba-clearpass
user-query client-id CPPM-SRX
Use the previously copied Client Secret generated by ClearPass.
set services user-identification authentication-source aruba-clearpass
user-query client-secret <Client Secret>
Define the token-api, this is always the same value.
set services user-identification authentication-source aruba-clearpass
user-query token-api api/oauth
Define the query-api, this is always the same value
set services user-identification authentication-source aruba-clearpass
user-query query-api api/v1/insight/endpoint/ip/$IP$
The commands above will generate the following configuration (the client secret will be encrypted):
root@SRX650-TME> show configuration services user-identification

authentication-source aruba-clearpass {

authentication-entry-timeout 100;

user-query {

web-server {

cppmserver160;

connect-method https;

address 10.2.100.160;

}

client-id CPPM-SRX;

client-secret
"$9$PTznCAuhSlaZqfzFtp8Lx7VYZUif5zZU9A0Bhc4oJUH.5QFn/tJGF6ApB1NdVwaG.P53n9jHORcyMWik.PTFREceMLRhv87-wsJZUj.f69ApORFncyre8LkqmPz69Ap";
\## SECRET-DATA

token-api api/oauth;

query-api "api/v1/insight/endpoint/ip/$IP$";
Configuring Ingress Event Processing for SRX
ClearPass can consume inbound syslog messages, parse them, and trigger an action such as an enforcement update for a user or endpoint. For example, an update regarding the posture or health of an endpoint can trigger an enforcement update for the device or user role, or it can trigger an update to a data center or internet access firewall based on the new context.
This feature allows event-driven, real-time enforcement within the enterprise network and enables a more effective protection framework.
Multiple steps are required to configure the Ingress Event Notification Framework. One of the more complex steps relates to the definition of the inbound parsing dictionary. Several dictionaries are supplied by default.
Note that Ingress Events Dictionaries can be added or created at any time. They do not require a ClearPass software release or patch.
Enable Ingress Events Processing
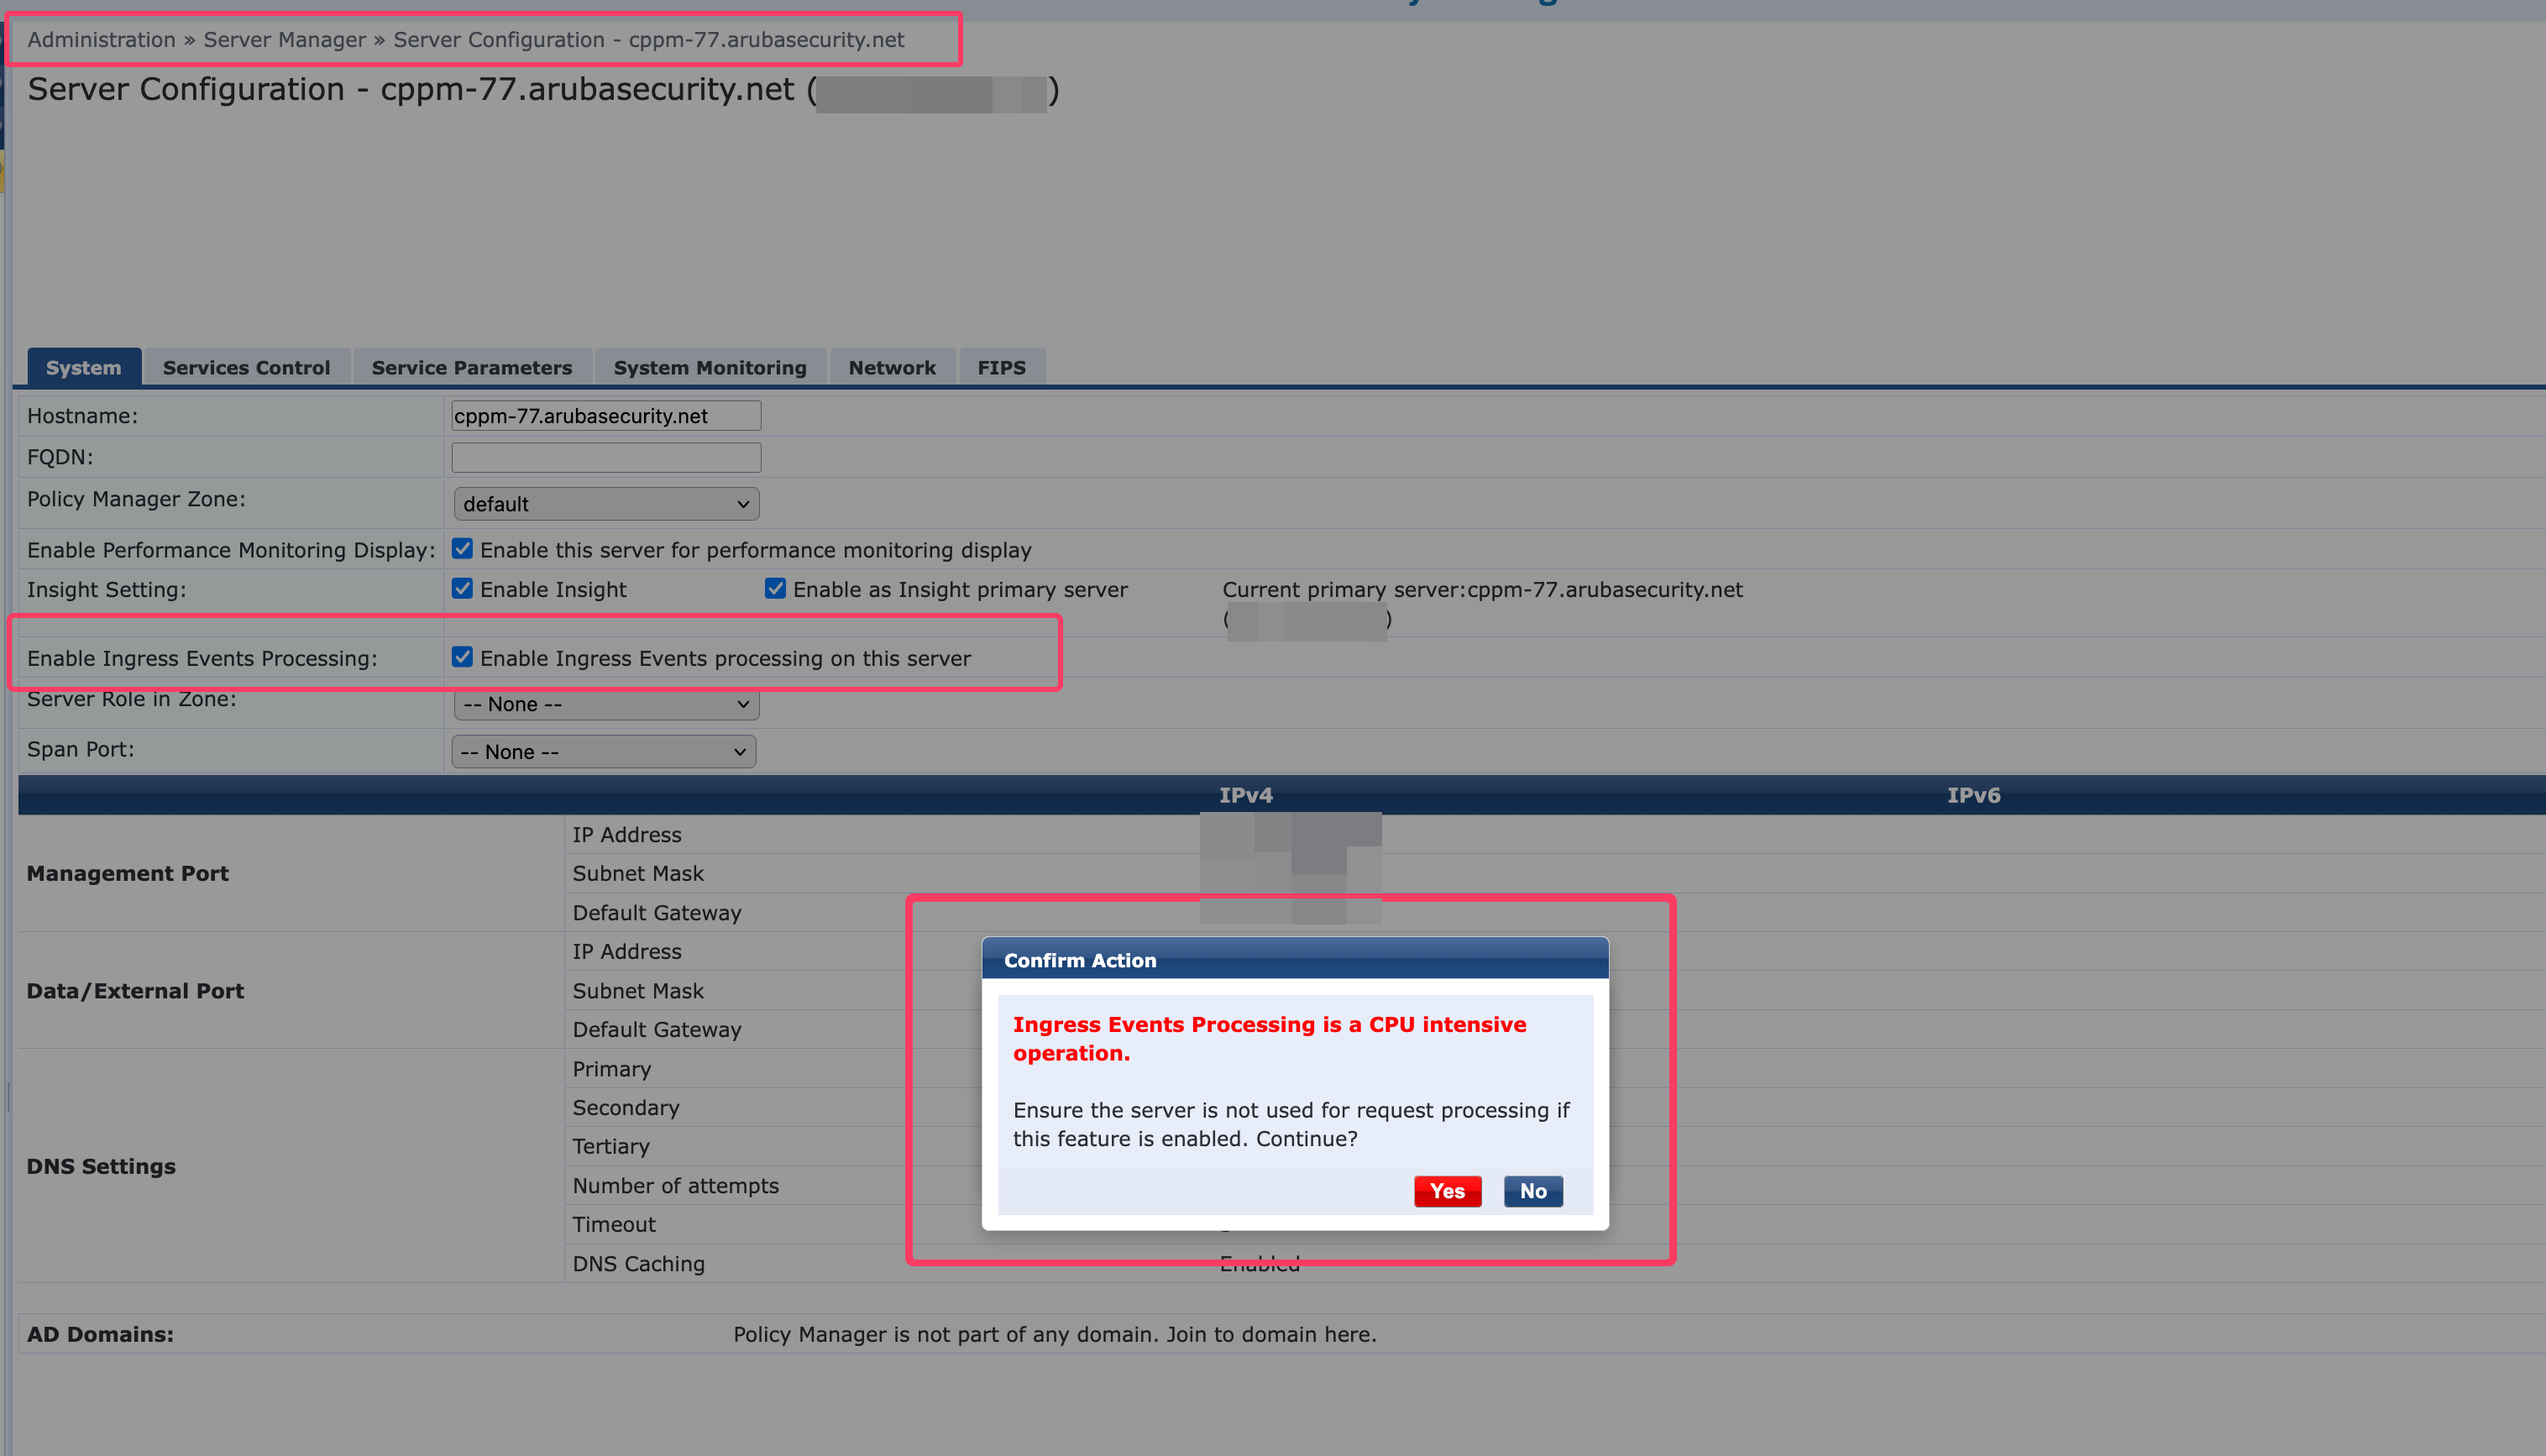
Navigate to Administration -> Server Manager -> Server Configuration -> [Your ClearPass Node] -> System
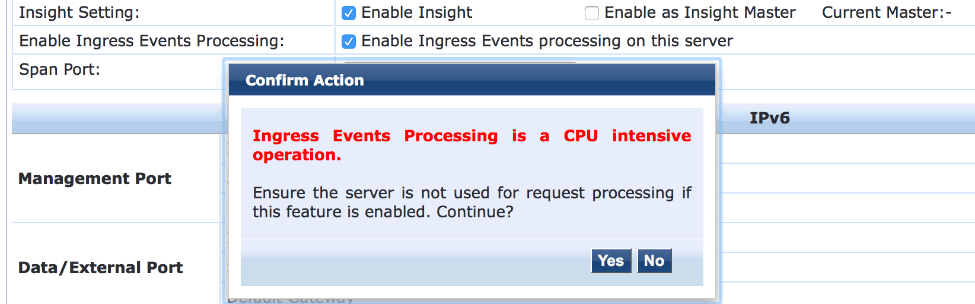
When enabling this feature a warning message is displayed as shown below which highlights and warns of the potential consequences. This feature can generate a significant CPU load on the ClearPass appliance.
NOTE
Careful consideration and planning are required before using this feature. ClearPass should only receive syslog messages by exception that require processing and action. A constant stream of syslog messages will likely cause the appliance to become unresponsive and may lead to failure or timeout of the primary authentication function.
Guidelines around enabling Ingress Event processing
Care must be taken when using this feature. While there are no exact deployments where it cannot be enabled, the following guidelines provide direction. The overriding resource issue is CPU cycles. It is possible for an appliance running at 80% CPU load to handle this feature without issue, while an appliance at 50% CPU load may experience problems. The key factor is not the current CPU load but the additional load that inbound syslog messages will generate. Appliances with multiple CPUs will perform better.
The intent behind this feature is for ClearPass to take a remediation action in response to a critical event seen in the network which typically does not happen in a constant stream. If the syslog messages received by ClearPass is highly curated and not a constant stream, it should be fine to enable this feature. ClearPass should be able to handle up to 1 event per second without issues. High rate of events or high load on the server can cause ingress event parsing to slow down considerably and even fail completely.
Hardware
Specific care needs to be taken when using C1000 / N1000 appliances. Especially if you plan to enable this on the older hardware, again the gating factor is “What CPU load will this generate on the appliance?”.
Virtual Machine
For virtual machines, it has always been difficult to control allocated resources, especially CPUs. Because this is a CPU-intensive workload, extra attention must be paid to the CPUs assigned to the virtual machine and current CPU usage.
General
In a cluster of multiple appliances or when the syslog messages might be numerous, it may be practical to dedicate an appliance to processing Ingress events.
If this feature is expected to be a major part of the deployment, a process should be undertaken to model the expected load and determine whether a dedicated appliance is required. If the deployment uses hardware appliances and a dedicated hardware appliance is not available for load modeling, deploy a temporary virtual machine to establish a baseline and better understand the demands of the Ingress workload. It is not recommended to deploy this feature on an appliance that is already running TCP Profiling. The combination of these two CPU-intensive tasks should be avoided.
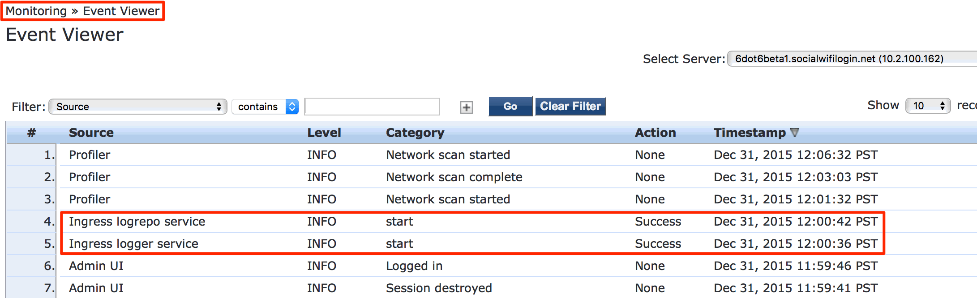
Confirm Ingress Services are running
Start the services if they are stopped.
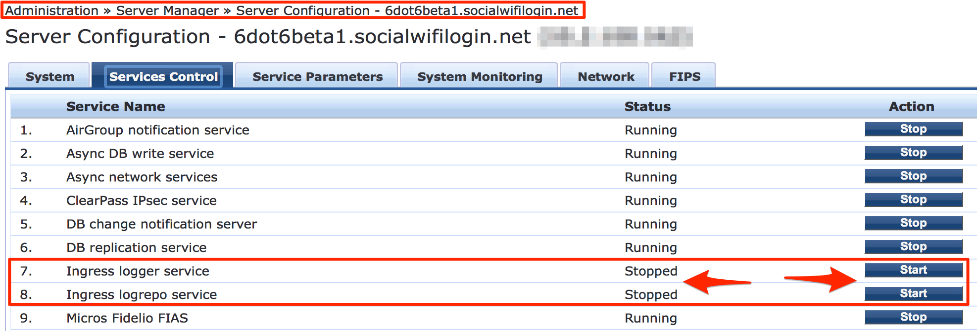
If the services do not start check under Monitoring -> Event Viewer for additional messages.
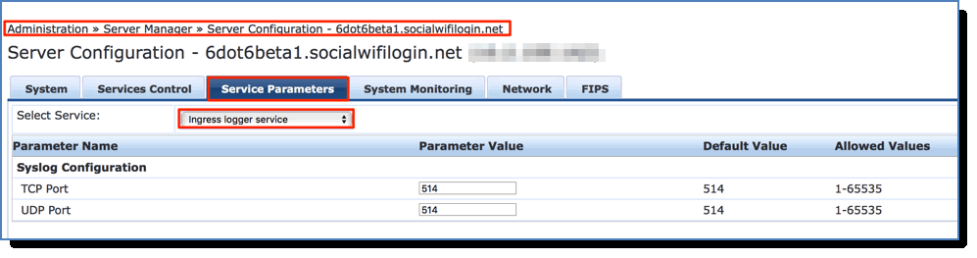
Configure Ingress port.
The logger service is responsible for listening on the defined port
(default 514) and ingesting the syslog messages. Configure the TCP/UDP
port at:
Administration -> Server Manager -> Server Configuration ->
[Your ClearPass Appliance] -> Service Parameters [Ingress logger
service]
Configuring the Ingress Events Dictionary
This file takes the structured or unstructured syslog messages and turns them into fields or attributes that can be referenced within a namespace.
Multiple Ingress Event Dictionaries are supplied by default. For the Juniper SRX integration, several dictionaries are available because the firewall can send syslog in multiple formats (primarily structured and traditional). By default, the SRX dictionaries are disabled and must be enabled. Only the required dictionaries should be enabled.
INFO
If the syslog format do not match what is defined in the default dictionaries, please reach out to product team via support for help with creating a custom one.
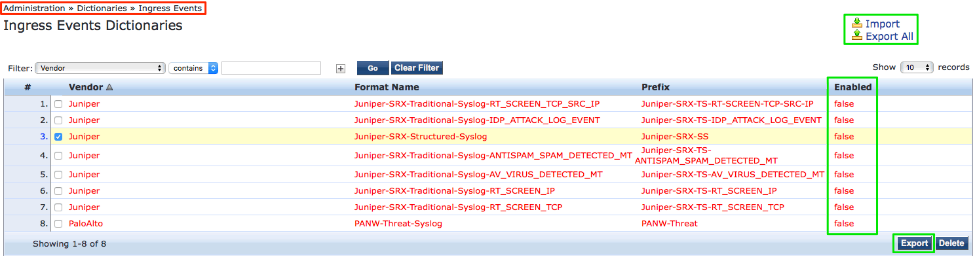
Enable the required dictionary at: Administration-> Dictionaries -> Ingress Events.
Click the desired dictionary and enable it.
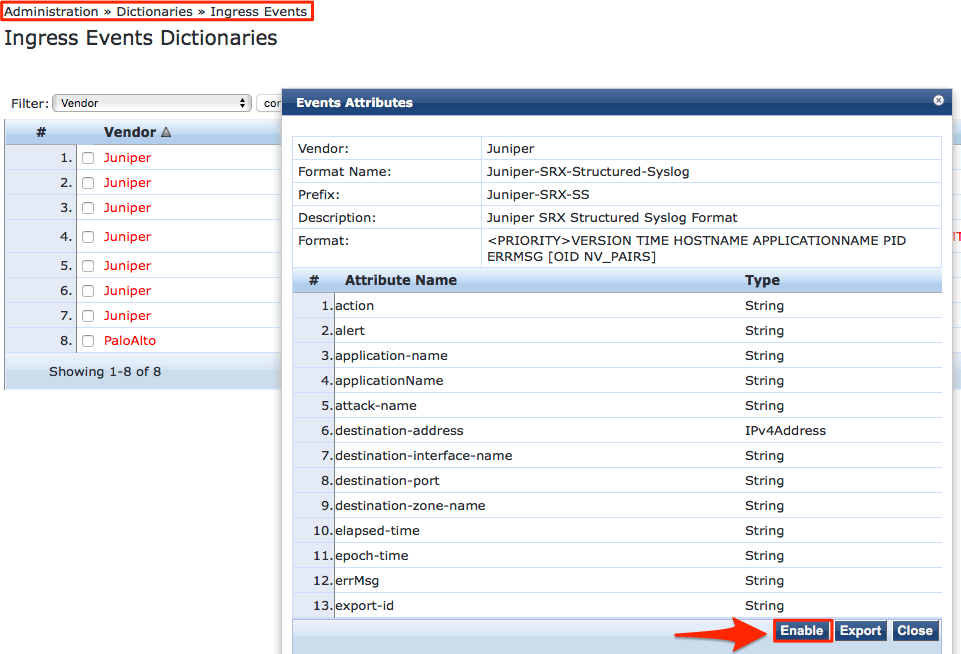
Note the Attribute Names in the screenshot. These are the fields that parse the incoming syslog data. These fields can later be referenced in policy processing.
Add the Event Source
Define the event source at: Configuration -> Network -> Events Sources -> Add
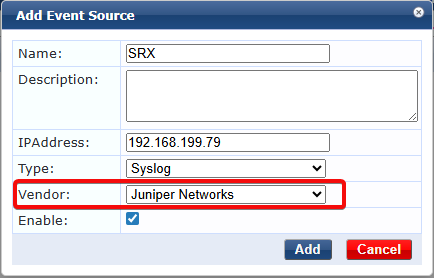
Choose the correct vendor from the drop-down and make sure to enable the Event Source.
Building the Actions and Events
The following section describes how to add the necessary Enforcement Policies, Profiles, and Services to ClearPass. This configuration allows ClearPass to ingest the logs, parse the data, extract content and context from the syslog messages, and take action based on the received data.
The examples below may differ from the exact methods used in your environment to take advantage of the Ingress Events engine. However, they illustrate the framework and methodology offered by the Ingress engine and explain the core concept behind it.
Add the Enforcement Profile – Update Endpoint
Create a policy that is used to update an endpoint attribute when a “threat” has been detected. Create an Enforcement Policy under Configuration -> Enforcement -> Profiles -> Add and use the template ClearPass Entity Update Enforcement.
An endpoint attribute can be created or one that is supplied can be used. If a custom attribute is required, create it first in the Endpoint Attributes Dictionary. Depending on the logic used, an endpoint attribute may be updated or an attribute may be added to show the endpoint is in an unresolved state.
Consideration must be given to how these attributes will be removed or reset once the threat has been resolved or remediated.
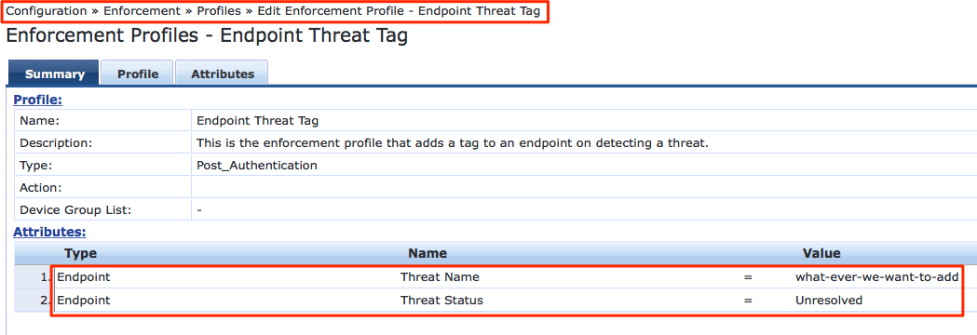
Add the Event Enforcement Policy
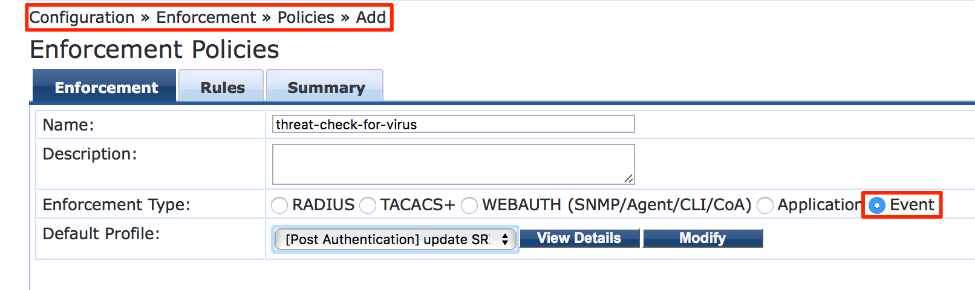
Create an Event Enforcement Policy at: Configuration -> Enforcement -> Policies -> Add and confirm that the Enforcement Type is Event
The Rules tab is where the events to key off are defined. The available options depend on which Event Dictionaries have been enabled. For this example, two SRX dictionaries and one PANW dictionary were enabled. If a custom Ingress Events dictionary has been created and enabled, it will appear here.
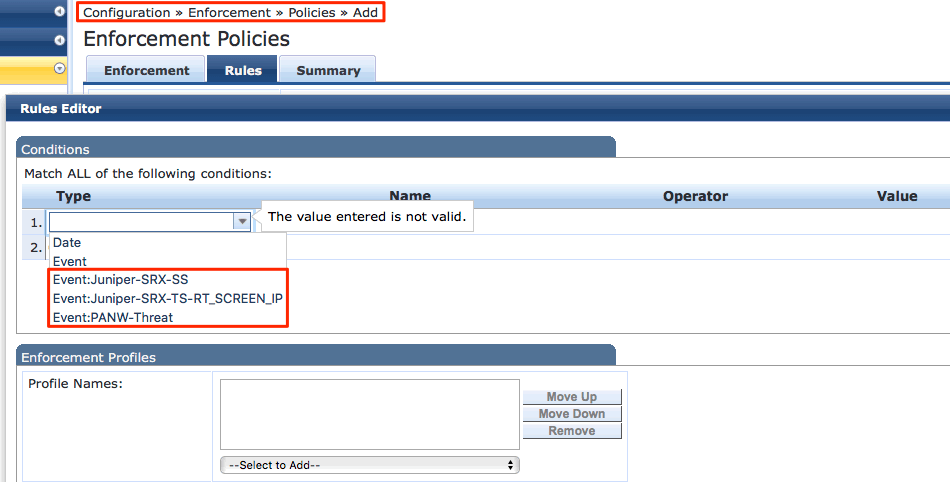
Choosing ‘Juniper-SRX-SS’ and expanding the namespace ‘Name’ displays
all fields configured in that Ingress Event Dictionary.
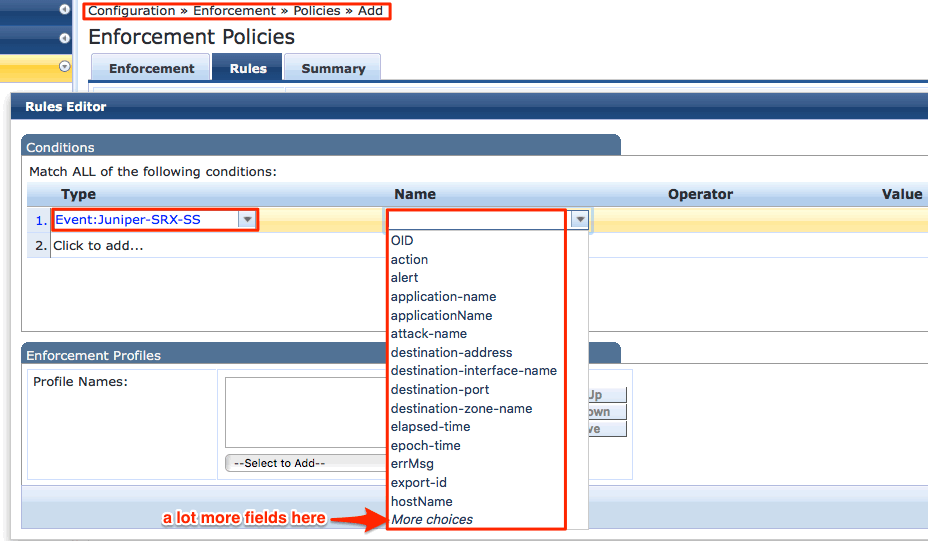
In the example a simple check is used to demonstrate the configuration. You can set the policy to trigger an update to the endpoint if the word “threat” is seen in the alert field.
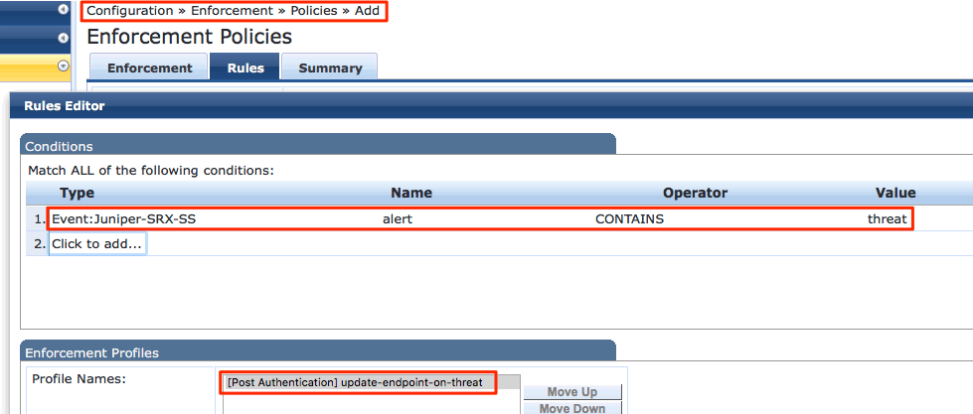
Numerous fields are available and any field in the namespace ‘Name’ can be used to trigger an event with operators such as CONTAINS, EQUALS, EXISTS, BEGINS_WITH, NOT_EQUAL, NOT_CONTAINS, NOT_BELONGS_TO, etc.
Add the Event Service
Create this under Configuration -> Services -> Add with the type as Event-based Enforcement.
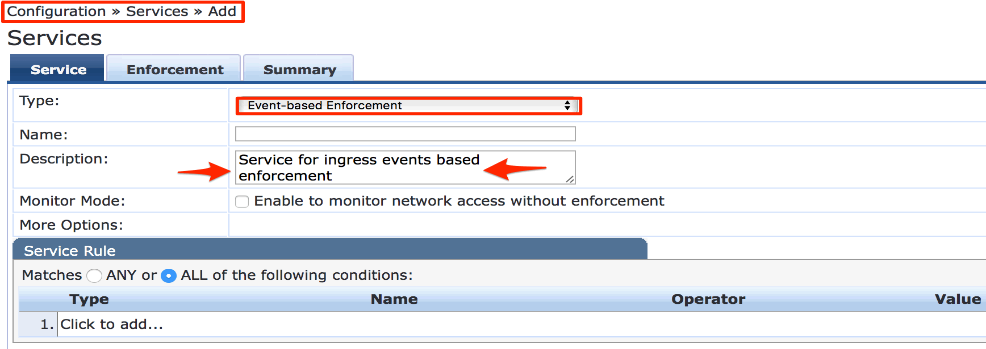
Setup is now complete to receive and parse syslog messages from an HPE Juniper SRX firewall. In the example, an endpoint in the Endpoint Database is marked as malicious or out-of-policy. ClearPass then triggers an enforcement action. Typically, for a device flagged as malicious, the desired outcome is to quarantine or isolate the device or user. A typical enforcement action is to issue a Change of Authorization (CoA) so that ClearPass can re-evaluate the device based on its updated status.
Tuning the Ingress Event Engine [IEE] Processing
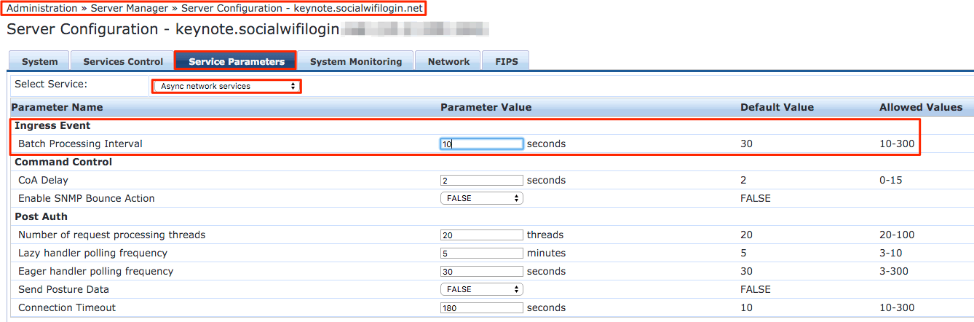
The process of ingesting syslog messages, parsing the data, and writing it to the Event Database before triggering an event can take time. This process is heavily dependent on the physical resources available on the appliance, the number of dictionaries enabled, and the Batch Processing Interval.
The Batch Processing Interval determines how frequently the Event Engine checks the Event Database for new entries. On lower-powered or older hardware, the default of 30 seconds should suffice, but it may need to be increased.
For the C3010, N3001 hardware appliance, or an appliance dedicated to
IEE processing, this parameter may need to be lowered to make the
process more real-time.
Setting up Syslog on Juniper SRX
The syslog configuration on a Juniper SRX can be extensive. Logs can be stored locally or sent to an external syslog server. Events can be logged from the system and/or from traffic. The focus for this integration is data-plane traffic logs. These logs are generated by processes that control data flow, such as the firewall and IPS processes.
INFO
For the process of integration with ClearPass, we will have to use ‘stream’ mode. The default mode is ‘event’.
Below is a basic syslog configuration.
root@SRX650-TME> show configuration system syslog

archive size 100k files 3;

user \* {

any emergency;

}

file messages {

any critical;

authorization info;

}

file interactive-commands {

interactive-commands error;

}
To configure the SRX to forward data-plane syslog messages to a ClearPass appliance, several settings are required. The example below contains the core requirements to send to two syslog servers. It demonstrates the ability of the SRX to send syslog messages to multiple targets and to differentiate by syslog type, formatting, category, etc.
The configuration shows system/node-specific settings such as stream mode and source address, along with two ClearPass appliances (to_cppm and to_beta1) that can override system-level settings.
INFO
Stream mode is normally used on high-end SRX devices but can be configured on any model. It is configured under the security stanza. In stream mode, logs are sent to the remote syslog server (in this case ClearPass) directly from the data plane and do not affect SRX device performance. Because of this, the logs cannot be saved locally (no control plane processing). However, care must be taken not to overwhelm the ClearPass appliance with syslog messages.
root@SRX650-TME> **show configuration security log**

mode stream;

format syslog;

source-address 10.2.51.132;

stream to\_cppm {

severity debug;

format sd-syslog;

filter threat-attack;

host {

10.2.51.210;

port 514;

}

}

stream to\_beta1 {

severity critical;

format syslog;

category idp;

host {

10.2.100.162;

port 514;

}

}
INFO
The SRX can rate-limit the syslog messages being sent (configuration not shown here).
ClearPass Access Tracker Logs Examples
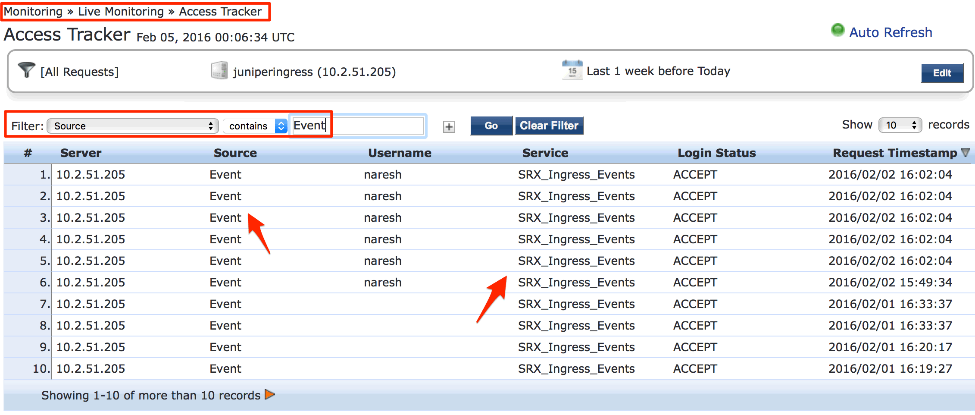
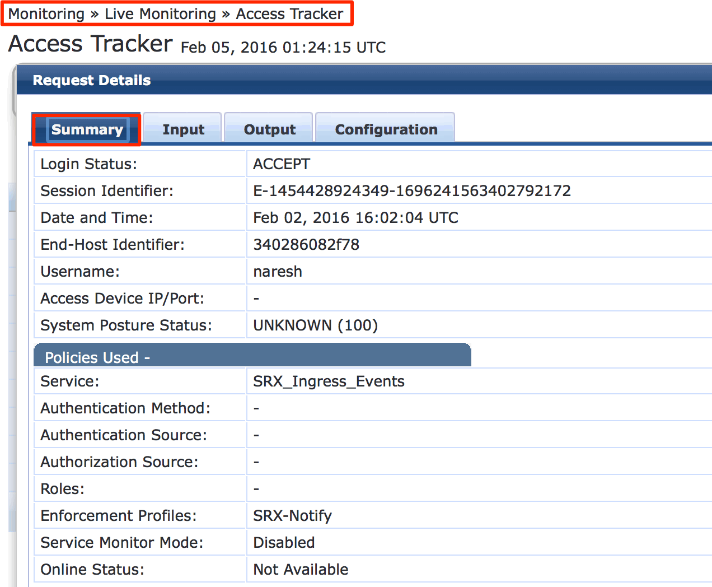
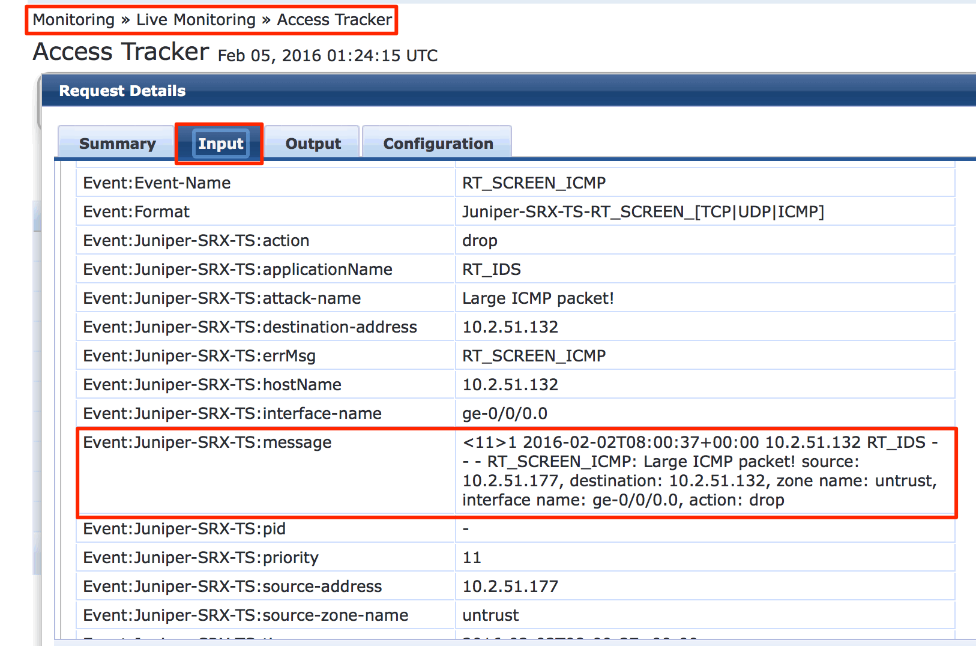
The following examples show the logs posted in the ClearPass Access Tracker when an Event occurs. The view is filtered to show only Events.
Validation
Monitoring user context under JUNOS webapi
To validate user authentication context is being received from ClearPass use the following command.
matt@nac-srx.arubasecurity.net> show services user-identification authentication-table authentication-source aruba-clearpass extensive
Logical System: root-logical-system

Domain: GLOBAL
Total entries: 1
  Key: 10.127.209.150
    Username: host/oak-win-01
    Groups:posture-unhealthy, c2c_fullaccess, domain computers, [machine authenticated]
    State: Valid
    Source: Aruba ClearPass
    Access start date: 2026-05-15
    Access start time: 16:26:56
    Last updated timestamp: 2026-05-15 23:28:10
    Age time: 28
INFO
- Groups equate to ClearPass Roles
- ClearPass Posture is sent as a Role (SRX Group).
Validate user-query (Pull Method)
Use the commands below to validate the user-query method.
root@SRX650-TME> show services user-identification
authentication-table authentication-source aruba-clearpass extensive

Domain: ns-tme

Total entries: 1

Source-ip: 10.2.100.167

Username: djump

Groups:posture-unknown, \[user authenticated\], rooted

State: Valid

Source: Aruba ClearPass

Access start date: 2026-04-30

Access start time: 15:45:56

Last updated timestamp: 2026-04-30 23:45:15

Age time: 100
Clear the SRX Auth table
root@SRX650-TME> clear services user-identification
authentication-table authentication-source aruba-clearpass
Confirm the authentication-table is clear
root@SRX650-TME> show services user-identification
authentication-table authentication-source aruba-clearpass extensive

warning: "There is no authentication-table entry."
Force the SRX to request an update from ClearPass (It is actually querying ClearPass via Rest APIs)
root@SRX650-TME> request services user-identification
authentication-source aruba-clearpass user-query address 10.2.100.167
Confirm user is in authentication-table.
root@SRX650-TME> show services user-identification
authentication-table authentication-source aruba-clearpass extensive

Domain: GLOBAL

Total entries: 1

Source-ip: 10.2.100.167

Username: djump

Groups:posture-unknown, \[user authenticated\], rooted

State: Valid

Source: Aruba ClearPass

Access start date: 2026-04-30

Access start time: 15:47:37

Last updated timestamp: 2026-04-30 23:45:22

Age time: 100
Monitoring the user-query (Pull Method)
Using the below JUNOS CLI commands from operational-mode, you can check the status of the ClearPass to SRX connectivity.
root@SRX650-TME> show services user-identification
authentication-source aruba-clearpass user-query status

Authentication source: aruba-clearpass

Web server Address: 10.2.100.160
Status: Online
Current connections: 1
Monitoring the number of requests/responses between ClearPass and the SRX
root@SRX650-TME> show services user-identification
authentication-source aruba-clearpass user-query counters

Authentication source: aruba-clearpass

Web server Address: 10.2.100.160

Access token: 0f0d31e4bfcd4809d67535ecc68298f25d2ca036

Request sent number: 3

Total response received number: 3

Error response received number: 0

Time of last response: 2026-04-30 11:38:53
Appendix
SRX Query Rate to ClearPass for Session Data
In all SRX platforms, the max query rate is 600 queries / minute.
Additional Resources
Integrating ClearPass with Juniper Networks SRX Endpoint Context Server
The ClearPass RESTful API’s SRX is querying (Pull Method)
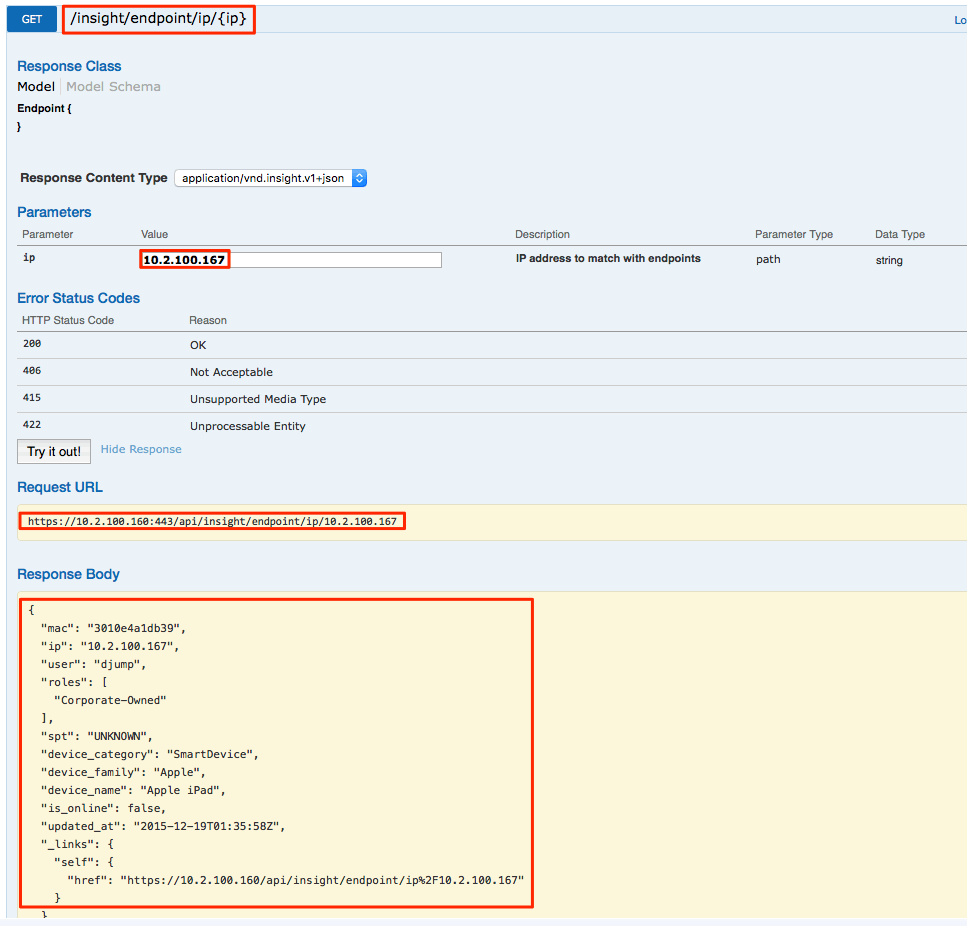
The following are the REST APIs that the SRX uses to pull user data.

Using the IP query, the API was tested via the Swagger interface. A
wealth of data is returned for the endpoint 10.2.100.167.
Feedback
Was this page helpful?
Glad to hear it!
Sorry to hear that.