Security Log Viewer
Monitoring > Security > Security Log Viewer
On the Security Log Viewer tab, you can view real-time or stored (historical) security logs from EdgeConnect appliances. You can view logs from up to eight appliances at a time. Security logs are displayed in a tabular format; for detailed descriptions of the columns shown on this tab, see Security Log Attributes. You can also download security logs from this tab for review offline.
You can view the following types of security logs on the Security Log Viewer tab:
-
IDS/IPS logs—Contain information about intrusion detection/prevention events.
-
Firewall logs—Contain information about network traffic, connection states, and rule matches for zone-based firewall and Secure Web Services.
-
Firewall protection profile logs—Contain information about threshold-based security events, such as DoS protection actions including Drop excess, Rapid aging, SYN Cookie, and Smart SYN Cookie.
-
Stateful WAN drops logs—Contain information about inbound packet drops on WAN interfaces due to congestion, security policies, or resource limits.
You can also access the Global Firewall Policies and Firewall Drops tabs by clicking the links at the top of the page.
View Real-Time Security Logs
The default option for viewing logs on the Security Log Viewer tab is RealTime. Complete the following steps to view real-time security logs:
-
Navigate to Monitoring > Security > Security Log Viewer.
-
Select the log type.
-
Select up to eight appliances from the appliance tree.
-
Click RealTime.
-
Click Run.
Orchestrator streams and displays real-time security logs for the selected appliances. Logs continuously stream in the background, and the table refreshes to display new logs every 5 seconds.
-
Change refresh interval—Click the refresh timer arrow and select an option from the menu (5 seconds, 10 seconds, or 20 seconds). The refresh timer is only active when real-time logs are streaming.
-
Pause log streaming—Move the toggle to enable Pause. Orchestrator continues to stream and accumulate logs in the queue for the selected appliances.
-
Resume log streaming—Move the toggle to disable Pause. When you resume streaming, the log table is marked with a thick line indicating the last log received before pausing. If you navigate to another Orchestrator tab and then return to the Security Log Viewer tab, the thick line will not persist.
-
Stop log streaming—Click Stop. The refresh timer becomes inactive.
If you pause or stop streaming real-time logs, you can switch to another Orchestrator tab. When you return to the Security Log Viewer tab, the logs are still there and visible.
-
NOTE: Real-time log viewing is intended for active, short-duration troubleshooting while traffic or security events are being generated. It is not intended for unattended, long-running log collection. For historical analysis or logs generated over a longer period, use appliance stored logs.
View Stored Security Logs
When viewing stored security logs, the table has a default maximum line limit of 50,000 and one log is displayed per line. If you have multiple appliances selected, the 50,000 lines are distributed across the appliances, so an equal number of logs are displayed for each appliance. Before you retrieve logs in the selected date range, you can click the info icon (i) next to the Retrieve button to view a preview of how many logs will be shown for each appliance.
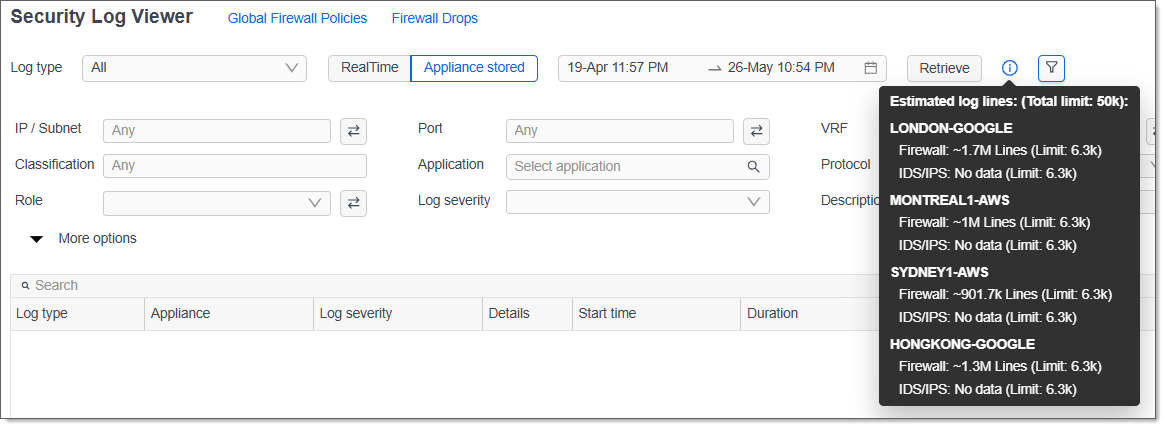
You can change the maximum line limit for retrieved logs in Orchestrator Advanced Properties. For more information, see Configure Maximum Line Limit for Security Logs.
If the selected date range contains more than 50,000 logs, the system notifies you that only the first 50,000 logs will be displayed. You can view all the logs in the range by clicking Retrieve, which loads logs in increments of 50,000. Continue clicking Retrieve to view the next 50,000 logs.
To view security logs that are stored (historical) on an appliance:
-
Navigate to Monitoring > Security > Security Log Viewer.
-
Select the log type.
-
Select up to eight appliances from the appliance tree.
-
Click Appliance stored.
-
Select a start date/time and click OK. Then select an end date/time and click OK.
If you have multiple appliances selected, you can click the info icon (i) to see how many logs per appliance the system will display.
NOTE: The available date range is based on the earliest and latest log dates for the selected appliance(s). If you selected multiple appliances, the range is limited to the period (earliest date and latest date) when security logs are available for all selected appliances. This ensures you cannot select a range with no data.
-
Click Retrieve.
Orchestrator retrieves and displays the stored security logs for the selected appliances within the specified date range. When viewing appliance stored logs, you can navigate to another Orchestrator tab and the retrieved logs will continue to be displayed on the Security Log Viewer tab when you navigate back to it.
Configure Maximum Line Limit for Security Logs
To configure the maximum line limit, you must modify the Orchestrator Advanced Properties. The ability to modify Orchestrator Advanced Properties depends on your Orchestrator deployment.
-
Self-hosted/on-prem Orchestrator users can edit the Orchestrator Advanced Properties using the following instructions.
-
Orchestrator-as-a-Service (OaaS) users must open a TAC case to request changes to the Orchestrator Advanced Properties.
-
In Orchestrator, navigate to Orchestrator > Software & Setup > Setup > Advanced Properties.
The Orchestrator Advanced Properties dialog box opens.
WARNING: Use caution when modifying Orchestrator Advanced Properties. Verify your changes before applying them.
-
Set the following security log property values as necessary:
Security Log Property Description Range securityRealtimeLogsLimit Maximum number of real-time security logs that can be displayed (one line per log). Allowable range: 10,000-200,000 lines. The default is 20,000. securityStoredLogsLimit Maximum number of stored (historical) security logs that can be displayed (one line per log). Allowable range: 10,000-200,000 lines. The default is 50,000. -
Click Save.
You do not need to restart Orchestrator to activate the changes to the security log advanced properties.
Filter Security Logs
To filter displayed logs, click the filter icon to show the filter options. To view more filters, click More options. To apply selected filters, click Apply. To clear filters, click Clear.
The following table describes the filters that you can apply to the security log table.
| Filter | Description |
|---|---|
| Log type | To view a specific type of security log, select an option from the Log type menu (Firewall, Stateful WAN drops, Firewall protection profile, or IDS/IPS). The default is All. |
| IP / Subnet | To view logs associated with a specific IP address or subnet, enter it in the IP / Subnet field; this filter shows logs that contain this IP address or subnet as the source or destination. To view logs associated with a specific source IP address or subnet, click the source/destination button and enter it in the Source field. To view logs associated with a specific destination IP address or subnet, click the source/destination button and enter it in the Destination field. |
| Classification | To view IDS/IPS logs associated with a specific security or threat classification, enter it in the Classification field. |
| Role | To view logs associated with a specific network security/identity role, select it from the Role menu; this filter shows logs that contain this role for both source and destination traffic. To view logs associated with a specific network security/identity role for source traffic, click the source/destination button and select it from the Source menu. To view logs associated with a specific network security/identity role for destination traffic, click the source/destination button and select it from the Destination menu. |
| Username | To view logs associated with a specific username, enter it in the Username field. |
| Web category | To view logs associated with a specific type of web content, enter it in the Web category field. |
| Port | To view logs associated with a specific port, enter it in the Port field; this filter shows logs that contain this port for either source or destination traffic. To view logs associated with a specific source port, click the source/destination button and enter it in the Source field. To view logs associated with a specific destination port, click the source/destination button and enter it in the Destination field. |
| Application | To view logs associated with a specific application, select an option from the Application menu. |
| Log severity | To view logs by severity, select an option (EMERGENCY, ALERT, CRITICAL, ERROR, WARNING, NOTICE, INFO, or DEBUG). The default displays logs with all severity types. |
| Overlay | To view logs associated with a specific business intent overlay (BIO), enter it in the Overlay field. |
| Flow ID | To view logs associated with a specific flow ID, enter the ID in the Flow ID field. |
| VRF | To view logs associated with a specific routing segment (VRF), select it from the VRF menu; this filter shows logs associated with selected segment for both source and destination traffic. To view logs associated with a specific routing segment for source traffic, click the source/destination button and select it from the Source menu. To view logs associated with a specific routing segment for destination traffic, click the source/destination button and select it from the Destination menu. |
| Protocol | To view logs associated with a specific network protocol, select it from the Protocol menu. |
| Description | To view logs associated with certain keywords in the log description, enter the keywords in the Description field. |
| App protocol | To view logs associated with a specific application-layer protocol, enter it in the App protocol field. |
| IP reputation | To view logs associated with a specific IP reputation score for source and destination traffic, enter it in the IP reputation field. To view logs associated with a specific IP reputation score for source traffic, click the source/destination button and enter it in the Source field. To view logs associated with a specific IP reputation for destination traffic, click the source/destination button and enter it in the Destination field. |
| Zone | To view logs associated with a specific network zone for source and destination traffic, select it from the Zone menu. To view logs associated with a specific network zone for source traffic, click the source/destination button and select it from the Source menu. To view logs associated with a specific network zone for destination traffic, click the source/destination button and select it from the Destination menu. |
| Event | To view logs associated with a specific Firewall protection profile event, enter keywords in the Event field. |
| Signature ID | For IDS/IPS events, enter the unique identifier for a signature profile to view logs associated with it. |
| HTTP method | To view logs associated with a specific HTTP request method, select an option from the HTTP method menu (GET, POST, PUT, DELETE, PATCH, HEAD, OPTIONS, CONNECT, or TRACE). |
Security Log Attributes
The Security Log Viewer tab displays security logs in a table, with each column representing an attribute from the logs. The following table describes the information shown, including the security log type(s) that each attribute applies to.
| Column (attribute) | Description | Applicable to Log Type |
|---|---|---|
| Log type | Type of security log (IDS/IPS, Firewall, Firewall protection profile, or Stateful WAN drops). | All |
| Appliance | Name of the appliance associated with the recorded log. | All |
| Log severity | Severity level of the logged event (EMERGENCY, ALERT, CRITICAL, ERROR, WARNING, NOTICE, INFO, or DEBUG). | All |
| Details | Click the info icon (i) to open the Log details dialog box, which contains additional attributes included in the log. | All |
| Start time | Timestamp (date and time) the event started. | Firewall |
| Duration | Total time the event lasted. | Firewall |
| End time | Timestamp (date and time) the event ended. | Firewall |
| Classification | Security or threat classification assigned to the event. | IDS/IPS and Firewall protection profile |
| Zone | Network zone where the event occurred. | Firewall protection profile |
| Protocol | Network protocol in use when the event occurred. | All |
| Event | Short description of the logged event. | Firewall protection profile |
| Application | Application running when the event occurred. | Firewall |
| Zone ID | Identifier for the network zone associated with the logged event. | Firewall protection profile |
| Description | Short description of the logged event. | Stateful WAN drops |
| Src VRF | Routing segment where the traffic originated. | IDS/IPS |
| Threshold ID | Identifier for the threshold rule that was evaluated or triggered. | Firewall protection profile |
| Src domain | Source domain name of the originating host. | Firewall and IDS/IPS |
| Dst domain | Destination domain name of the target host. | Firewall and IDS/IPS |
| Dst VRF | Routing segment where the traffic was headed. | IDS/IPS |
| Metric | Metric setting for the Firewall Protection Profile threshold. | Firewall protection profile |
| Src port | Source port number used by the originating host. | Firewall, IDS/IPS, and Stateful WAN drops |
| Signature ID | Unique identifier for the signature profile in use during the logged IPS/IDS event. | IDS/IPS |
| Threshold value | Configured FPP threshold value during the logged Firewall protection profile event. | Firewall protection profile |
| Priority | Priority level assigned to the event. | IDS/IPS |
| Threshold action | Action taken when FPP threshold was breached. | Firewall protection profile |
| Dst port | Destination port number targeted by the traffic. | Firewall, IDS/IPS, and Stateful WAN drops |
| Timestamp | Date and time when the security log was recorded. | IDS/IPS, Firewall protection profile, and Stateful WAN drops |
| Src zone | Network zone associated with the source of the traffic. | Firewall and IDS/IPS |
| Dst zone | Network zone associated with the destination of the traffic. | Firewall and IDS/IPS |
| Action | Action taken by the appliance for this traffic (for example, allow, deny, drop). | Firewall |
| VRF name | Name of the routing segment (VRF) where the event occurred. | Firewall and Firewall protection profile |
| Mode | Deployment mode the appliance was operating in during the event (IDS, IPS-Performant, or IPS-Inline). | IDS/IPS |
| Reason | Indicates why the action was taken by the appliance for the traffic involved in this event (flow create, flow end, implicitly deny). | Firewall |
| Flow ID | Unique identifier for the traffic flow associated with the event. | Firewall |
| Overlay | Business Intent Overlay (BIO) assigned to the traffic involved in the event. | Firewall |
| Dst address | Destination IP address involved in the event. | Firewall and Stateful WAN drops |
| Src address | Source IP address involved in the event. | Firewall, Firewall protection profile, and Stateful WAN drops |
| Length | Length of the dropped packet in bytes. | Stateful WAN drops |
| Input interface | Network interface on which the traffic was received. | Stateful WAN drops and Firewall |
| Generator ID | Identifier of the sensor or rule generator that produced the alert. | IDS/IPS |
| Revision ID | Revision or version number of the signature or rule that matched. | IDS/IPS |
| Web reputation | Reputation score associated with the FQDN/URL involved in the event. | Firewall |
| DSCP | Differentiated Services Code Point from the IP packet header. | Firewall |
| TCP flags | TCP header flags set in the connection (for example, SYN, ACK, FIN). | Firewall |
| NAT src IP | Source IP address after Network Address Translation. | Firewall |
| NAT src port | Source port number after Network Address Translation. | Firewall |
| User device | Identifier or hostname of the user device that generated the traffic. | Firewall |
| HTTP response | HTTP response status code returned by the server (for example, 200, 404). | Firewall |
| Flow drop code (secure web services) | Code that indicates why a flow was dropped: 0x0—Flow was allowed. 0x01—Flow was denied because the source IP address has a bad reputation. 0x02—Flow was denied because the destination IP address has a bad reputation. 0x04—Flow was denied because the URL has a bad reputation. 0x08—Flow was denied because the URL web category is blocked. 0x10—Flow was denied because the URL is blocked. |
Firewall |
| RX packets | Number of packets received for the logged flow or session. | Firewall |
| Username | Authenticated username associated with the traffic, if available. | Firewall |
| App protocol | Specific application-layer protocol detected (for example, HTTP/2, MQTT). | Firewall |
| Src role | Role assigned to the source host in role-based policies. | Firewall |
| Dst role | Role assigned to the destination host in role-based policies. | Firewall |
| TX packets | Number of packets transmitted for the logged flow or session. | Firewall |
| RX octets | Number of bytes received for the flow or session. | Firewall |
| TX octets | Number of bytes transmitted for the flow or session. | Firewall |
| Ingress VRF ID | Identifier for the VRF on the ingress interface. | Firewall |
| Egress VRF ID | Identifier for the VRF on the egress interface. | Firewall |
| Host | Hostname or IP address of the device that generated or is associated with the log. | Firewall |
| Tag | User-defined or system-defined tag applied to the event for grouping or filtering. | Firewall |
| Direction | Traffic direction relative to the device (ingress or egress). | Firewall |
| Threat | Named threat or indicator of compromise associated with the event. | IDS/IPS |
| Src IP reputation | Reputation score associated with the source IP address. | Firewall |
| Dst IP reputation | Reputation score associated with the destination IP address. | Firewall |
| Output interface | Network interface on which the traffic was sent out. | Firewall |
| HTTP method | HTTP request method used (for example, GET, POST, PUT). | Firewall |
| Web category | Category assigned to the FQDN/URL (for example, Shopping, Social Networking, Business, and so on). For information about the web categories, visit https://brightcloud.com/tools/change-request.php, and then click the Web Category Descriptions link. | Firewall |