Welcome to the SD-WAN Test Drive
The SD-WAN Test Drive is a fully operational SD-WAN environment that you can use to familiarize yourself with the EdgeConnect platform and Orchestrator management interface. If this is your first time using HPE Networking EdgeConnect SD-WAN, we’ve provided this simple guide to help orient you with some of the major features within the product. Please follow along with the guide below and enjoy.
Orchestrator Dashboard
The dashboard is the first thing you’ll see when accessing Orchestrator. Upon login, administrators are presented with a detailed snapshot of their network. From here they can launch into advanced visibility and reporting to gain a more in-depth view of specific sites, top applications, and any potential issues that need to be addressed across their networks.
Figure 1: Orchestrator Dashboard view

Health Map
Monitoring > Health Map
The Health Map provides a simple way to visualize the health of your entire network, without digging through logs, alarms, and reports. Administrators are presented with a 7-day view that allows them to see possible issues such as underperforming sites or circuits, configuration issues, network outages, and lingering performance issues.
Figure 2: Health Map view for all selected appliances

Business Intent Overlays
Configuration > Business Intent Overlays
Business Intent Overlays (BIOs or Overlays) are the key construct when configuring and deploying a business-driven SD-WAN. Administrators define the organization’s key requirements for different classes of applications, QoS, and security policies, ensuring consistency of policy enforcement across the network. Overlays allow you to delegate application routing, security, and optimization policies across your entire SD-WAN fabric.
Figure 3: Business Intent Overlays tab showing all virtual network overlays

Figure 4: Overlay configuration showing how policies are configured for traffic to route across your global Wide Area Network (WAN)

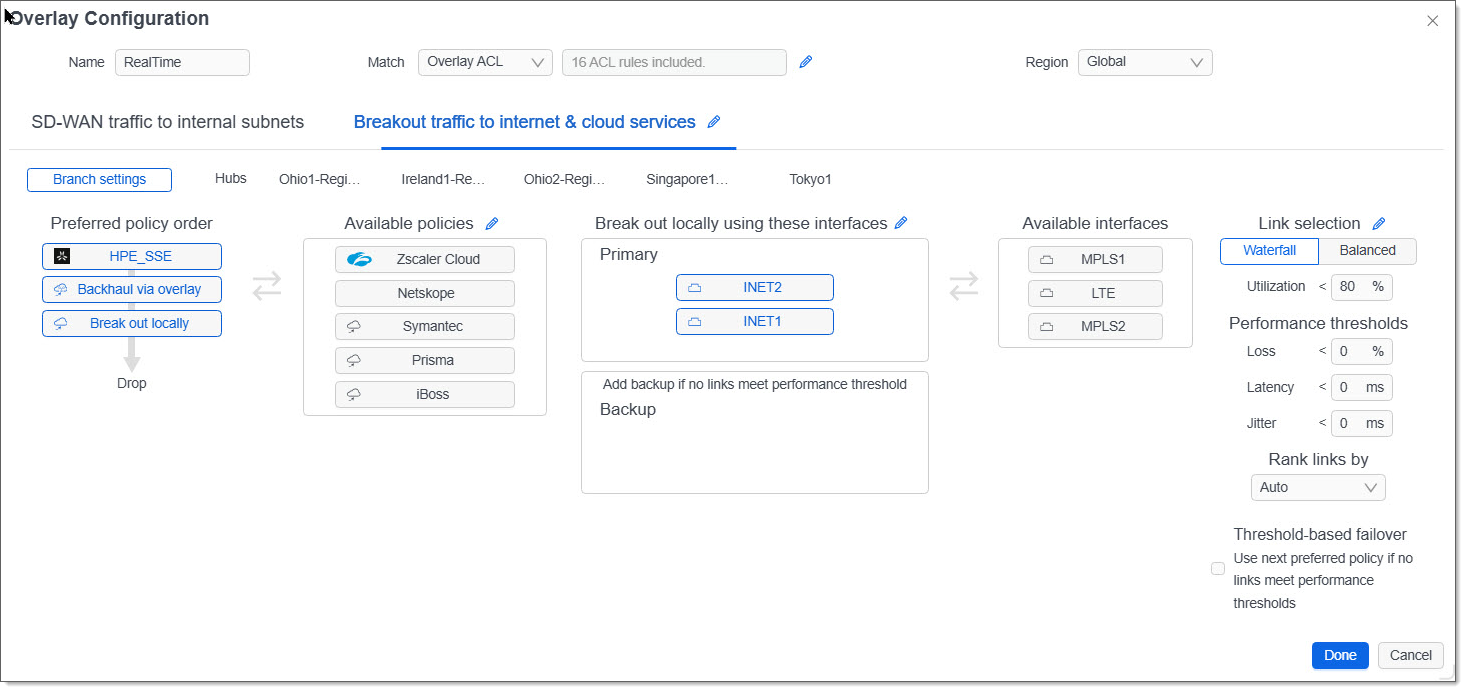
Figure 5: Overlay configuration showing how policies are configured for traffic routing to the Internet and cloud-based services
SASE Copilot
You can access the SASE Copilot icon ( ) from two places in the Orchestrator interface:
-
To the right of the search box at the top of the screen, where it opens the SASE Copilot panel.
-
Within specific monitoring and configuration grids, where it launches a workflow scoped to the row you select.
SASE Copilot is an AI-powered assistant built into Orchestrator that helps IT teams understand, manage, and troubleshoot their SD-WAN and SASE environment using natural language. It transforms complex operational data into clear, actionable insights.
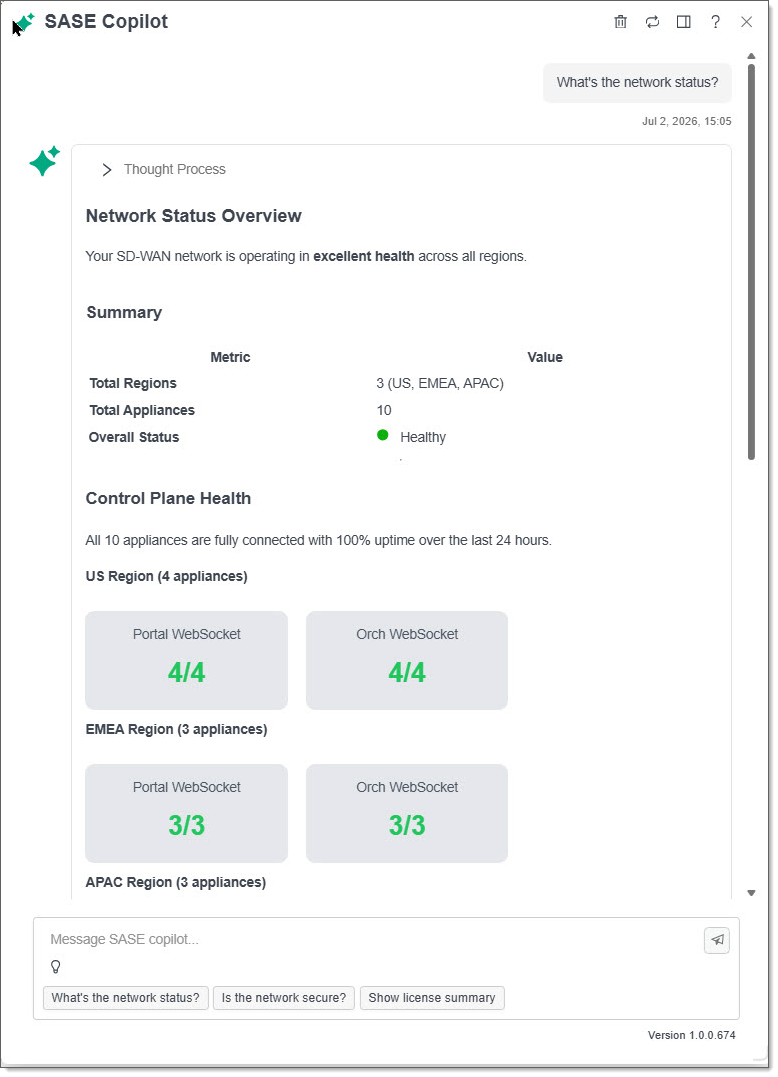
Simply ask questions like, “What’s the network status?” and SASE Copilot provides an instant health summary, highlights potential issues, identifies affected sites or users, and recommends next steps. This reduces the time spent navigating dashboards and searching through operational data.
Figure 6: SASE Copilot showing an overview of the network status
AppExpress
Monitoring > Performance > AppExpress Summary
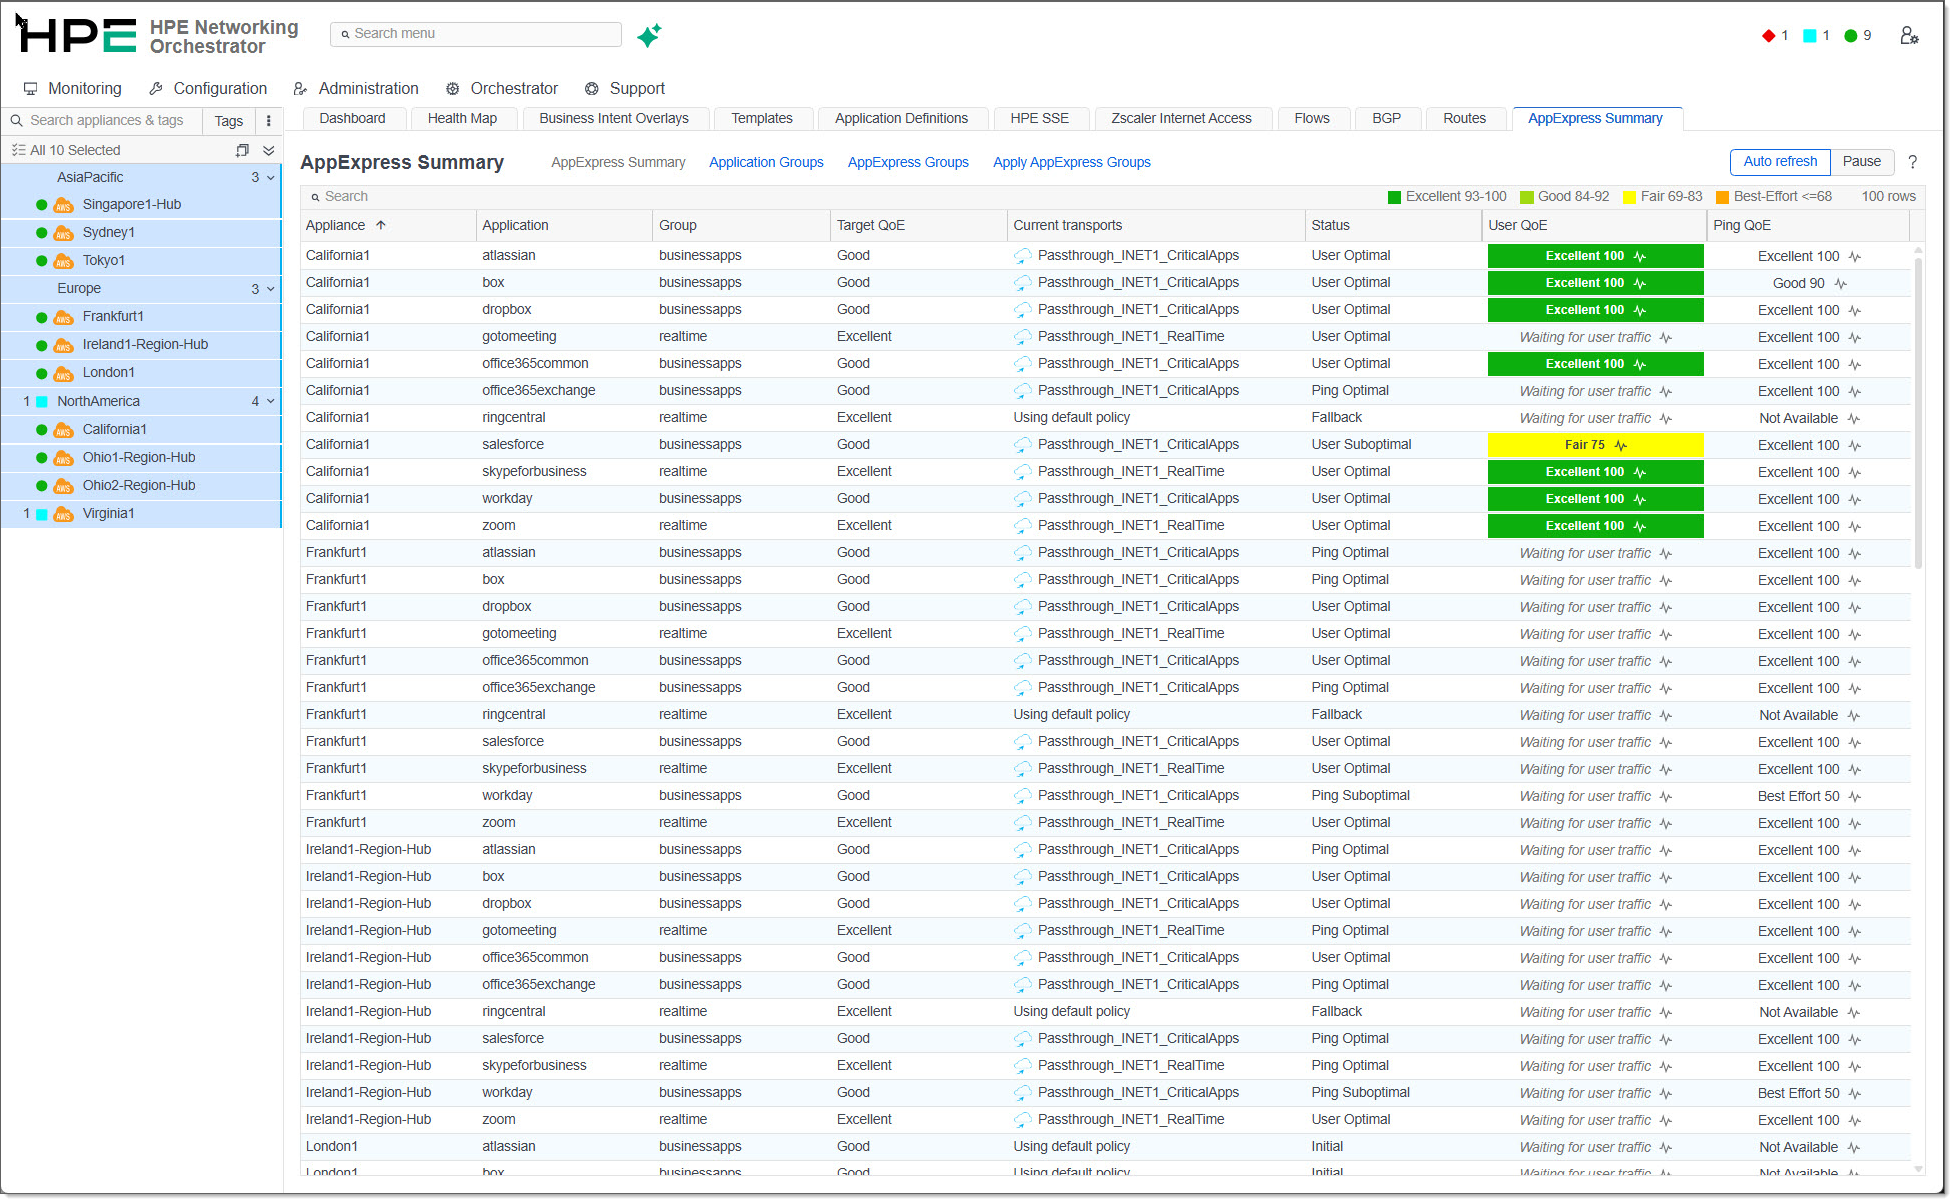
AppExpress provides deep visibility into application performance across your SD-WAN fabric, helping IT teams quickly understand how business-critical applications are performing for users. It delivers actionable insights into application availability, latency, loss, jitter, and overall user experience.
With AppExpress, administrators can identify performance issues befores users are impacted, isolate network bottlenecks, and gain end-to-end visibility into application behavior across branches, data centers, and cloud environments.
Figure 7: AppExpress Summary
Network Templates
Configuration > Templates
Templates provide an easy way to standardize and automate the process of making changes across the entire network, providing a single, centralized point of orchestration and management. Making changes to QoS, DNS, NTP, or zone-based firewall policies is done through a simple set of templates and then pushed out and maintained across all sites on the network.
Figure 8: System template

First-packet iQ Application Engine
Configuration > Application Definitions
First-packet iQ™ enables you to identify, classify, and automatically steer millions of applications on your network, while constantly staying up-to-date with Cloud Intelligence. If there are internal applications that need to be classified, they can also be added here and propagated across the entire SD-WAN fabric for visibility, security, and control.
Figure 9: Application definitions

Cloud Services
Configuration > Cloud Services
HPE Networking is focused on enabling customers to build a better WAN. This focus extends to a broad ecosystem of technology alliance partners. Two key focus areas include security and public cloud IaaS partnerships.
This entire Demo runs on AWS infrastructure, while any combination of Azure, Google Cloud, and Oracle Cloud are also supported. HPE Networking has also integrated the EdgeConnect platform with Microsoft Office 365 and Microsoft virtual WAN.
For security, HPE Networking has fully automated integration with Check Point Software and Zscaler with support for a number of other leading security partners. For this lab, Zscaler has been configured with a subscription and API key. Once provided, Orchestrator will locate the two closest ZEN nodes for each EdgeConnect appliance and automatically build primary and secondary tunnels to them.
Figure 10: Zscaler internet access

Flows
Monitoring > Active and Recent Flows
Administrators can see every active session or recently closed sessions across the entire SD-WAN fabric. The appliances selected on the left tree return information on all flows/sessions currently active (or ended). Administrators can also filter based on any of the fields above the table for more granular results.
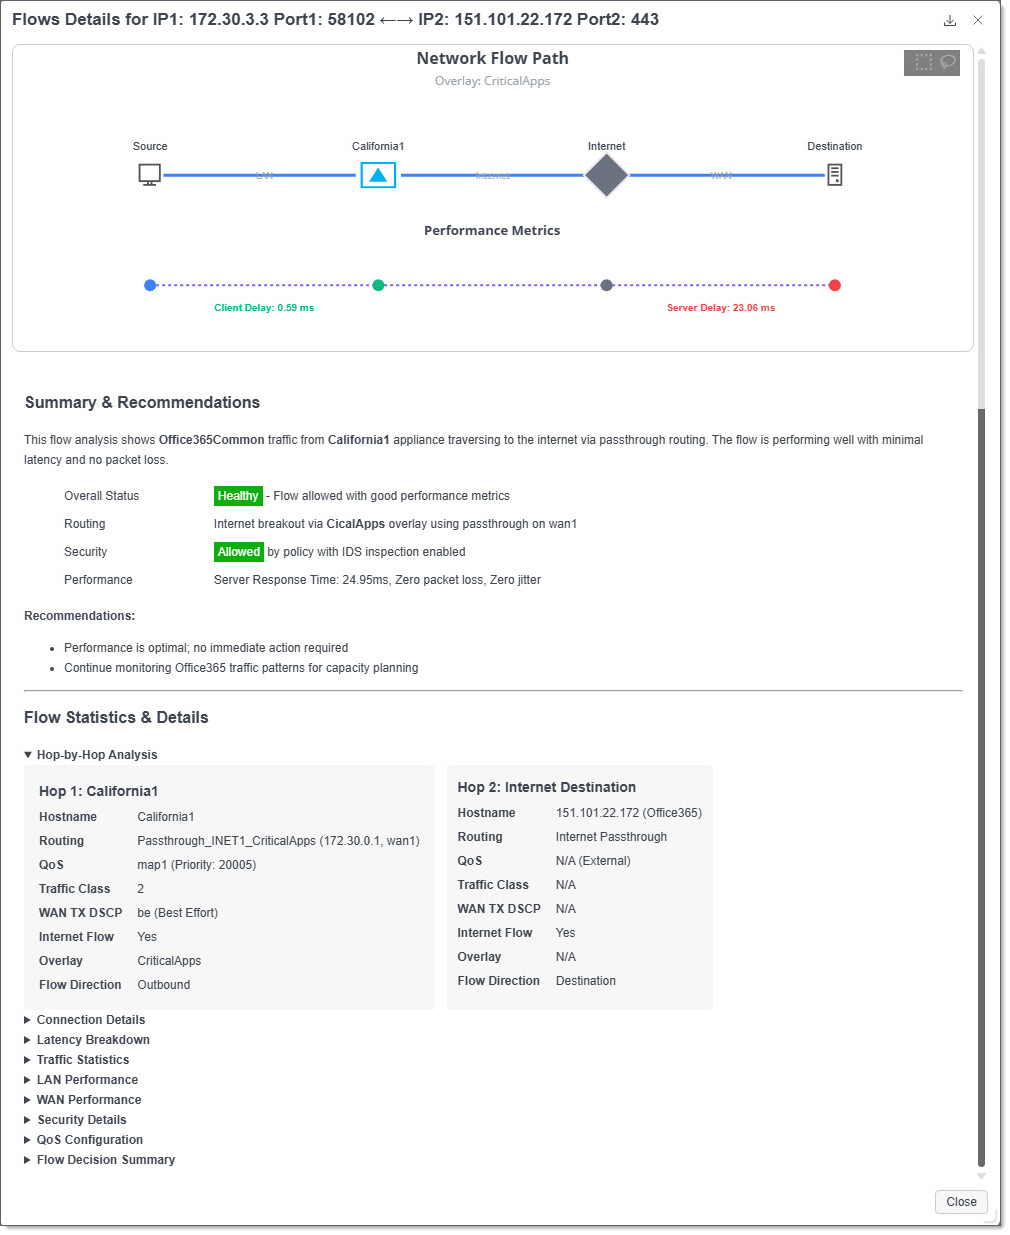
Imagine a situation where a user or site reports an issue with an application. The Flows tab helps to quickly filter and identify the affected traffic, the exact rules that are being matched (look at the details section of any flow), and app performance feedback. This detailed information feeds into all tabs in the monitoring section.
Figure 11: Flows tab showing all active flows from all EdgeConnect appliances

Figure 12: Flow AI Insights detail
BGP
Configuration > BGP
A business-driven SD-WAN should use all available paths in the best combination possible, which goes against using legacy routing protocols that install a single best path. During a customer’s migration to SD-WAN, or for peering with MPLS and other providers, BGP is a great way to maintain reliable connectivity and interoperability.
On the following BGP screen, you will see a single peering relationship on the Ohio appliances.
Figure 13: BGP summary for all appliances

On the Configuration > Routes tab, administrators can quickly identify which EdgeConnect appliance is advertising a given route, whether that route was originated by the appliance or learned from BGP (or OSPF), and additional details about the route (tags, etc.).
Figure 14: Routes tab

Want More?
-
Ready to talk? Contact us and we’ll be in touch.
-
Other HPE Networking training and certification programs are available here: HPE Networking Education Services